1992 United States House of Representatives elections in Connecticut|
|
|
| Turnout | 83.9%[1] |
|---|
|
|
Majority party
|
Minority party
|
|
|
|
|
| Party
|
Republican
|
Democratic
|
| Last election
|
3
|
3
|
| Seats won
|
3
|
3
|
| Seat change
|

|
|
| Popular vote
|
699,155
|
644,424
|
| Percentage
|
48.72%
|
44.90%
|
|
 District results District results
|
Republican
40–50%
60–70%
|
Democratic
50–60%
60–70%
| |
The 1992 United States House of Representatives elections in Connecticut were held on November 3, 1992, to elect the six members of the U.S. House, one from each of the state's congressional districts, to represent Connecticut in the 103rd Congress. These elections coincided with the Presidential election and a U.S. Senate election, as well as elections to the state legislature.
The elections took place after the 1990 United States census. Connecticut maintained its number of congressional districts, and the redistricted map was adopted on November 27, 1991.[2] The elections were also on the backdrop of the election of Connecticut Governor Lowell Weicker in 1990, beginning the rise of the A Connecticut Party. This was the first election in which the party ran candidates on the federal level.
All incumbents ran for re-election. No district changed partisan control, meaning the 3-3 split between the Democrats and Republicans was maintained.
Overview
| United States House of Representatives elections in Connecticut, 1992[3][4][5]
|
| Party
|
Votes
|
Percentage
|
Seats
|
+/–
|
|
|
Republican
|
699,155
|
48.72%
|
3
|
0
|
|
|
Democratic[a]
|
644,424
|
44.90%
|
3
|
0
|
|
|
A Connecticut
|
65,701
|
4.58%
|
0
|
0
|
|
|
Concerned citizens
|
20,211
|
1.41%
|
0
|
0
|
|
|
Natural Law
|
2,309
|
0.16%
|
0
|
0
|
|
|
Independent
|
1,677
|
0.12%
|
0
|
0
|
|
|
Petitioning candidate
|
1,661
|
0.11%
|
0
|
0
|
|
|
Write-in candidates
|
25
|
0.00%
|
0
|
0
|
| Totals
|
1,435,163
|
100.00%
|
6
|
—
|
District 1
1992 Connecticut's 1st congressional district election|
|
| Turnout | 81.2%[1] |
|---|
|
|
|
Incumbent Democrat Barbara B. Kennelly, who was originally elected in 1981, faced Republican opponent Philip L. Steele. She won re-election with 67.1% of the vote.
Results
District 2
1992 Connecticut's 2nd congressional district election|
|
| Turnout | 85.4%[1] |
|---|
|
|
|
Incumbent Democrat Sam Gejdenson, originally elected in 1981, went up against Republican nominee Edward W. Munster, a State Senator from Haddam. Gejdenson narrowly won re-election to a seventh term with 50.8% of the vote, although Munster initially refused to concede.[6]
Results
District 3
1992 Connecticut's 3rd congressional district election|
|
| Turnout | 80.8%[1] |
|---|
|
|
|
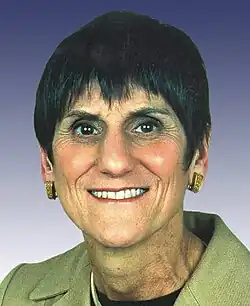
Incumbent Democrat Rosa DeLauro faced Republican challenger and former State Senator Tom Scott. DeLauro won re-election to a second term with 65.68% of the vote. This was a significant overperformance compared her previous election result in 1990, in which she only narrowly won with 52% to 48% of the vote against Scott.
Results
District 4
1992 Connecticut's 4th congressional district election|
|
| Turnout | 84.0%[1] |
|---|
|
|
|
Incumbent Republican Christopher Shays, originally elected in 1987, faced Stamford Board of Finance member Dave Schropfer (D) and Darien attorney Al Smith (ACP). He won re-election with 67.3% of the vote.[7][8]
Results
District 5
1992 Connecticut's 5th congressional district election|
|
| Turnout | 85.8%[1] |
|---|
|
|
|
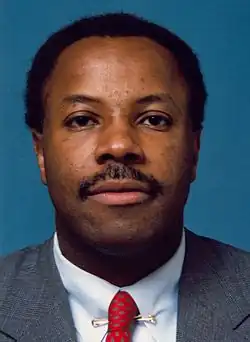
Incumbent Republican Gary Franks, the only Black Republican in congress at the time, faced Waterbury Probate judge James J. Lawlor (D) and Democratic state representative from Danbury Lynn H. Taborsak (ACP). He won re-election to a second term with 43.65% of the vote.[9] Taborsak was previously a Democratic candidate for this district, but switched to the ACP ticket after she lost the September 15th primary against Lawlor.
Results
District 6
1992 Connecticut's 6th congressional district election|
|
| Turnout | 86.5%[1] |
|---|
|
|
|
Incumbent Republican Nancy Johnson faced Democratic challenger Eugene F. Slason. She won re-election with 69.7% of the vote.[10]
Results
Notes
- ^ Of the Democratic total, there were only 501,887 votes cast for the Democratic party, while the additional 142,537 were votes for the A Connecticut Party who co-nominated 3 of the Democratic candidates.
References
|
|---|
| President | |
|---|
| U.S. Senate | |
|---|
U.S.
House | |
|---|
| Governors | |
|---|
State
legislatures | |
|---|
| Mayors | |
|---|
| States |
- Alabama
- Alaska
- American Samoa
- Arizona
- Arkansas
- California
- Colorado
- Connecticut
- Delaware
- Florida
- Georgia
- Guam
- Hawaii
- Idaho
- Illinois
- Indiana
- Iowa
- Kansas
- Kentucky
- Louisiana
- Maine
- Maryland
- Massachusetts
- Michigan
- Minnesota
- Mississippi
- Missouri
- Montana
- Nebraska
- Nevada
- New Hampshire
- New Jersey
- New Mexico
- New York
- North Carolina
- North Dakota
- Ohio
- Oklahoma
- Oregon
- Pennsylvania
- Puerto Rico
- Rhode Island
- South Carolina
- South Dakota
- Tennessee
- Texas
- United States Virgin Islands
- Utah
- Vermont
- Virginia
- Washington
- West Virginia
- Wisconsin
- Wyoming
|
|---|
|
|---|
Elections spanning
two years
(through 1879) | |
|---|
Elections held
in a single year
(starting 1880) | Regulars
and
even-year
specials | |
|---|
Odd-year
specials | |
|---|
|
|---|
| Elections by state |
- Alabama
- Alaska
- Arizona
- Arkansas
- California
- Colorado
- Connecticut
- Delaware
- District of Columbia
- Florida
- Georgia
- Hawaii
- Idaho
- Illinois
- Indiana
- Iowa
- Kansas
- Kentucky
- Louisiana
- Maine
- Maryland
- Massachusetts
- Michigan
- Minnesota
- Mississippi
- Missouri
- Montana
- Nebraska
- Nevada
- New Hampshire
- New Jersey
- New Mexico
- New York
- North Carolina
- North Dakota
- Ohio
- Oklahoma
- Oregon
- Pennsylvania
- Rhode Island
- South Carolina
- South Dakota
- Tennessee
- Texas
- Utah
- Vermont
- Virginia
- Washington
- West Virginia
- Wisconsin
- Wyoming
|
|---|
| Seat ratings | |
|---|
| Speaker elections | |
|---|
| Summaries | |
|---|
- Senate elections
- Presidential elections
- Gubernatorial elections
|



.jpg)
.jpg)