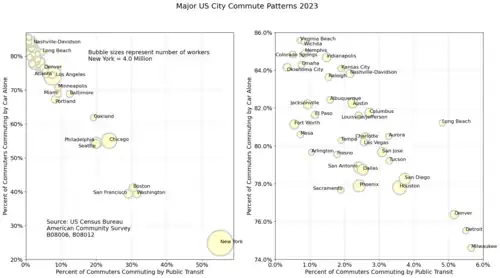
Percentage of public transport commuters in major U.S. cities in 2021 The following is a list of United States cities of 100,000+ inhabitants with the highest rates of public transit commuting to work, according to data from the American Community Survey . The table shows 2015 baseline data alongside the most recent 2024 estimates, ranked by 2024 percentage. The survey measured the percentage of commuters who take public transit, as opposed to walking , driving or riding in an automobile , bicycle , boat , or some other means.
Rank
City
Public transit commuters
Public transit commuters[ 1]
1
New York City, New York 56.5%
48.7%
2
Jersey City, New Jersey 47.6%
45.1%
3
Mount Vernon, New York — N/a 28.4%
4
Washington, D.C. 37.4%
26.6%
5
Somerville, Massachusetts — N/a 26.1%
6
Boston, Massachusetts 33.7%
25.3%
7
San Francisco, California 33.1%
25.0%
8
Newark, New Jersey 26.7%
23.4%
9
Bayonne, New Jersey — N/a 23.0%
10
Yonkers, New York 26.4%
22.7%
11
Malden, Massachusetts — N/a 21.0%
12
Chicago, Illinois 27.6%
20.5%
13
Quincy, Massachusetts — N/a 20.5%
14
Philadelphia, Pennsylvania 26.2%
20.1%
15
Arlington, Virginia 26.4%
19.5%
16
Cambridge, Massachusetts 28.6%
19.2%
17
East Orange, New Jersey — N/a 19.0%
18
Hartford, Connecticut 16.6%
16.0%
19
Oakland, California 20.3%
15.5%
20
Lynn, Massachusetts — N/a 15.4%
21
Seattle, Washington 20.1%
15.0%
22
Evanston, Illinois — N/a 14.8%
23
Alexandria, Virginia 21.7%
14.4%
24
Berkeley, California 21.6%
14.2%
25
Pittsburgh, Pennsylvania 17.0%
13.8%
26
Passaic, New Jersey — N/a 13.3%
27
Daly City, California 19.8%
13.2%
28
Alameda, California — N/a 11.2%
29
Elizabeth, New Jersey 11.3%
10.1%
30
Baltimore, Maryland 18.6%
9.7%
31
Norwalk, Connecticut — N/a 9.7%
32
Newton, Massachusetts — N/a 9.5%
33
Honolulu, Hawaii 8.4%
8.2%
34
Richmond, California 14.0%
8.0%
35
St. Louis, Missouri 9.4%
7.9%
36
New Haven, Connecticut 13.3%
7.8%
37
Miami, Florida 11.4%
7.7%
38
Bellevue, Washington 11.8%
7.7%
39
Bridgeport, Connecticut 10.8%
7.6%
40
Paterson, New Jersey 11.9%
7.6%
41
Madison, Wisconsin 9.3%
7.6%
42
Buffalo, New York 11.7%
7.4%
43
East Los Angeles, California 10.9%
7.2%
44
Cleveland, Ohio 10.5%
7.2%
45
Minneapolis, Minnesota 13.1%
7.1%
46
Portland, Oregon 12.1%
7.1%
47
Naperville, Illinois 9.7%
6.9%
48
Gresham, Oregon 8.2%
6.6%
49
Providence, Rhode Island 8.3%
6.4%
50
Los Angeles, California 10.6%
6.2%
51
Atlanta, Georgia 9.8%
5.7%
52
St. Paul, Minnesota 8.5%
5.7%
53
Fremont, California 9.0%
5.5%
54
Milwaukee, Wisconsin 8.6%
5.4%
55
Rochester, New York 8.8%
5.2%
56
New Orleans, Louisiana 7.8%
4.1%
57
Cincinnati, Ohio 7.8%
3.9%
58
San Juan, Puerto Rico 8.7%
3.7%
—
Stamford, Connecticut 14.1%
— N/a [ 1]
—
Edison, New Jersey 13.4%
— N/a [ 1]
—
Ann Arbor, Michigan 11.2%
— N/a [ 1]
—
Concord, California 10.0%
— N/a [ 1]
See also
References
Sources