Opinion polling for the 2010 United Kingdom general election
| Opinion polling for UK general elections |
|---|
| 2001 election |
| Opinion polls |
| 2005 election |
| Opinion polls |
| 2010 election |
| Opinion polls |
| 2015 election |
| Opinion polls • Leadership approval |
| 2017 election |
| Opinion polls • Leadership approval |
Opinion polling for the 2010 United Kingdom general election was carried out by various organisations to gauge voting intention. Most of the polling companies listed are members of the British Polling Council (BPC) and abide by its disclosure rules. The opinion polls listed range from the previous election on 5 May 2005 to the election on 6 May 2010.
Graphical summaries
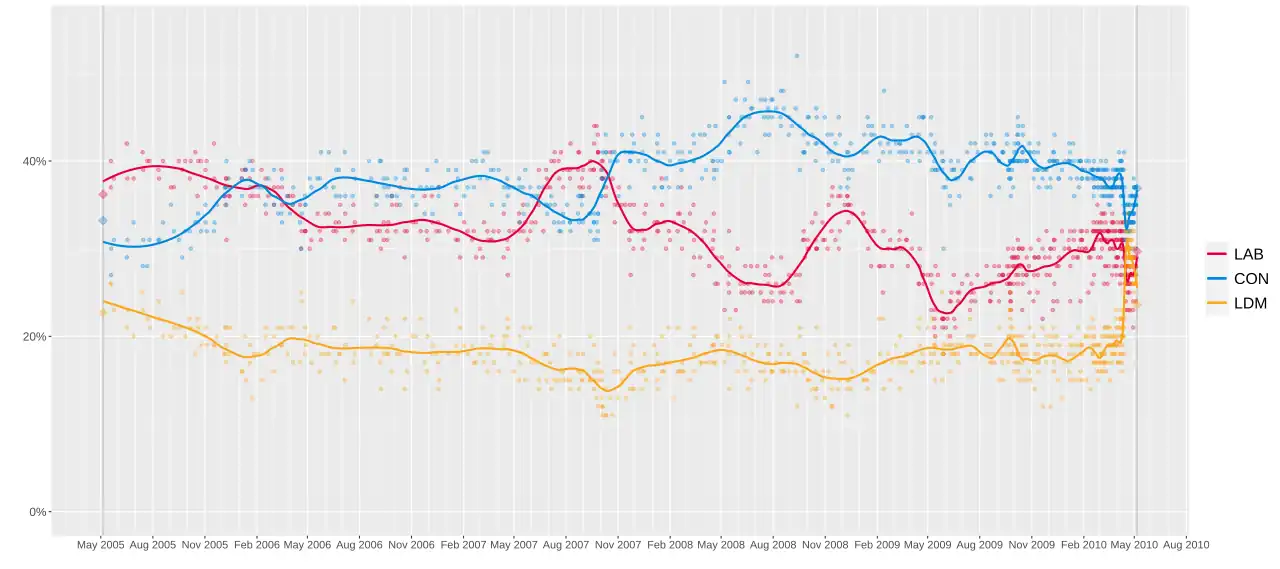
Immediately following the previous general election, the Labour Party held a double-digit lead in opinion polls. However, in the latter part of 2005, this lead was eroded somewhat. By December, the Conservative Party showed its first small leads in opinion polls following the controversial 90 days detention proposals and the election of David Cameron as Conservative leader.[1]
In early 2006, opinion polls were increasingly mixed with small leads given alternately to Labour and Conservative. From the 2006 local elections in May, in which Labour suffered significant losses, the Conservatives took a small single-digit lead in opinion polls. This was the first consistent lead of the opinion polls that the Conservatives had enjoyed for 14 years.
Labour regained the lead in June 2007, following the resignation of Tony Blair as prime minister after 10 years and the selection of Gordon Brown as his successor. Brown resisted calls from his party to hold a general election, despite opinion polls suggesting that Labour was capable of being re-elected at this stage.
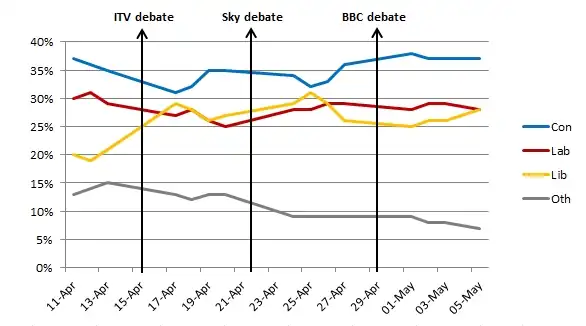
The Conservatives took the lead once again in November 2007. This grew wider in spring 2008, particularly in response to the onset of the great recession along with the increased unemployment that resulted from it. After a brief narrowing between Labour and the Conservatives in late 2008, the latter's lead widened again following the emergence of the MPs' expenses scandal in 2009. Though Labour slightly recovered in the latter half of 2009, the Conservatives maintained their lead through to election day. In the campaign period, the Liberal Democrats enjoyed a significant and unprecedented surge following the first televised debate of the party leaders, in which their leader Nick Clegg was widely seen as the strongest performer.
Guide to tables
Poll results are listed in the tables below in reverse chronological order. The highest percentage figure in each poll is displayed in bold, and its background is shaded in the leading party's colour. The "lead" column shows the percentage point difference between the two parties with the highest figures. When a poll result is a tie, the figures with the highest percentages are shaded and displayed in bold.
National poll results
Most national opinion polls do not cover Northern Ireland, which has different major political parties from the rest of the United Kingdom. As mentioned prior, most of the polling companies listed are members of the BPC; however, BPIX is not a BPC member and does not publish detailed methodology and findings.
2010
| Date(s) conducted |
Pollster | Client | Sample size |
Lab | Con | LD | Others | Lead |
|---|---|---|---|---|---|---|---|---|
| 6 May 2010 | 2010 general election | – | 29.7% | 36.9% | 23.6% | 9.8% | 7.2 | |
| 5 May | Ipsos MORI | Evening Standard | 1,216 | 29% | 36% | 27% | 8% | 7 |
| 4–5 May | YouGov | The Sun | 6,483 | 28% | 35% | 28% | 9%
UKIP on 3% BNP on 2% Greens on 1% SNP on 1% PC on 1% Other on 1% |
7 |
| 4–5 May | Harris Interactive | Daily Mail | 4,014 | 29% | 35% | 27% | 7% | 6 |
| 4–5 May | Populus Archived 25 July 2018 at the Wayback Machine | The Times | 2,505 | 28% | 37% | 27% | 8% | 9 |
| 4–5 May | Angus Reid Public Opinion | PoliticalBetting.com | 2,283 | 24% | 36% | 29% | 11%
UKIP on 4% BNP on 2% Greens on 1% SNP on 2% PC on 1% Other on 2% |
7 |
| 4–5 May | Opinium | Daily Express | 1,383 | 27% | 35% | 26% | 12% | 8 |
| 4–5 May | ComRes | Multiple
ITV News The Independent |
1,025 | 28% | 37% | 28% | 7% | 9 |
| 3–4 May | ICM | The Guardian | 1,527 | 28% | 36% | 26% | 10% | 8 |
| 3–4 May | YouGov | The Sun | 1,461 | 30% | 35% | 24% | 11% | 5 |
| 29 Apr – 4 May | TNS-BMRB | N/A | 1,864 | 27% | 33% | 29% | 11% | 4 |
| 28 Apr – 4 May | Harris Interactive | The Metro | 786 | 26% | 36% | 28% | 10% | 8 |
| 2–3 May | ComRes | Multiple
ITV News The Independent |
1,024 | 29% | 37% | 26% | 8% | 8 |
| 2–3 May | YouGov | The Sun | 1,455 | 28% | 35% | 28% | 9% | 7 |
| 30 Apr – 3 May | Opinium | Daily Express | 1,870 | 28% | 33% | 27% | 12% | 5 |
| 1–2 May | YouGov | The Sun | 1,475 | 28% | 34% | 29% | 9% | 5 |
| 1–2 May | ComRes | Multiple
ITV News The Independent |
1,024 | 29% | 37% | 26% | 8% | 8 |
| 30 Apr – 2 May | ICM | The Guardian | 1,026 | 28% | 33% | 28% | 12% | 5 |
| 30 Apr – 1 May | YouGov | The Sunday Times | 1,483 | 27% | 35% | 28% | 10% | 7 |
| 30 Apr – 1 May | ComRes | Multiple
The Independent Sunday Mirror |
1,019 | 28% | 38% | 25% | 9% | 10 |
| 30 Apr | YouGov | The Sun | 1,412 | 28% | 34% | 28% | 10% | 6 |
| 30 Apr | ICM | The Sunday Telegraph | 1,019 | 29% | 36% | 27% | 8% | 7 |
| 29–30 Apr | Angus Reid Public Opinion | Sunday Express | 1,874 | 23% | 35% | 29% | 12%
UKIP on 5% BNP on 3% Greens on 1% SNP on 1% PC on 1% Other on 1% |
6 |
| 28–29 Apr | YouGov | The Sun | 1,623 | 27% | 34% | 28% | 11% | 6 |
| 27–28 Apr | YouGov | The Sun | 1,530 | 27% | 34% | 31% | 8% | 3 |
| 26–27 Apr | YouGov | The Sun | 1,598 | 29% | 33% | 28% | 10% | 4 |
| 26–27 Apr | ComRes | Multiple
ITV News The Independent |
1,006 | 29% | 36% | 26% | 9% | 7 |
| 26–27 Apr | Populus | The Times | 1,510 | 27% | 36% | 28% | 8% | 8 |
| 21–27 Apr | TNS-BMRB | N/A | 2,078 | 27% | 34% | 30% | 9% | 4 |
| 25–26 Apr | YouGov | The Sun | 1,491 | 28% | 33% | 29% | 10% | 4 |
| 25–26 Apr | ComRes | Multiple
ITV News The Independent |
1,005 | 29% | 33% | 29% | 9% | 4 |
| 23–26 Apr | Opinium | Daily Express | 1,942 | 25% | 34% | 28% | 13% | 6 |
| 23–26 Apr | Angus Reid Public Opinion | The Economist | 2,433 | 23% | 33% | 30% | 14%
UKIP on 5% BNP on 2% Greens on 2% SNP on 1% PC on 1% Other on 3% |
3 |
| 20–26 Apr | Harris Interactive | The Metro | 1,678 | 25% | 32% | 30% | 13% | 2 |
| 24–25 Apr | YouGov | The Sun | 1,466 | 28% | 34% | 30% | 8% | 4 |
| 24–25 Apr | ComRes | Multiple
ITV News The Independent |
1,003 | 28% | 32% | 31% | 9% | 1 |
| 23–25 Apr | ICM | The Guardian | 1,031 | 28% | 33% | 30% | 8% | 3 |
| 23–24 Apr | YouGov | The Sunday Times | 1,412 | 27% | 35% | 28% | 9% | 7 |
| 23–24 Apr | ComRes | Multiple
The Independent on Sunday Sunday Mirror |
1,006 | 28% | 34% | 29% | 9% | 5 |
| 23 Apr | ICM | The Sunday Telegraph | 1,020 | 26% | 35% | 31% | 8% | 4 |
| 23 Apr | Ipsos MOR | News of the World | 1,245 | 30% | 36% | 23% | 11% | 6 |
| 22–23 Apr | YouGov | The Sun | 1,381 | 29% | 34% | 29% | 8% | 5 |
| 21–22 Apr | YouGov | The Sun | 1,576 | 29% | 34% | 28% | 9% | 5 |
| 20–21 Apr | YouGov | The Sun | 1,545 | 27% | 33% | 31% | 9% | 2 |
| 19–20 Apr | YouGov | The Sun | 1,595 | 26% | 31% | 34% | 9% | 3 |
| 19–20 Apr | Angus Reid Public Opinion | PoliticalBetting.com | 1,953 | 23% | 32% | 33% | 12%
UKIP on 4% BNP on 3% Greens on 2% SNP on 2% PC on 1% Other on 0% |
1 |
| 19–20 Apr | ComRes | Multiple
ITV News The Independent |
1,015 | 25% | 35% | 27% | 13% | 8 |
| 19–20 Apr | Populus | The Times | 1,501 | 28% | 32% | 31% | 9% | 1 |
| 18–20 Apr | Ipsos MORI | Evening Standard | 1,253 | 28% | 32% | 32% | 8% | Tie |
| 14–20 Apr | TNS-BMRB | N/A | 1,953 | 29% | 34% | 30% | 7% | 4 |
| 18–19 Apr | ComRes | Multiple
ITV News The Independent |
1,012 | 26% | 35% | 26% | 13% | 9 |
| 18–19 Apr | YouGov | The Sun | 1,509 | 27% | 33% | 31% | 8% | 2 |
| 16–19 Apr | Opinium | Daily Express | 1,957 | 26% | 32% | 29% | 13% | 3 |
| 16–19 Apr | Angus Reid Public Opinion | PoliticalBetting.com | 2,004 | 24% | 32% | 32% | 12%
UKIP on 4% BNP on 2% Greens on 2% SNP on 2% PC on 1% Other on 1% |
Tie |
| 14–19 Apr | Harris Interactive | The Metro | 1,792 | 26% | 31% | 30% | 13% | 1 |
| 17–18 Apr | ComRes | Multiple
ITV News The Independent |
1,003 | 28% | 32% | 28% | 12% | 4 |
| 17–18 Apr | YouGov | The Sun | 1,433 | 26% | 32% | 33% | 8% | 1 |
| 16–18 Apr | ICM | The Guardian | 1,024 | 28% | 33% | 30% | 9% | 3 |
| 16–17 Apr | YouGov | The Sunday Times | 1,490 | 30% | 33% | 29% | 8% | 3 |
| 16–17 Apr | ComRes | Multiple
The Independent on Sunday Sunday Mirror |
1,006 | 27% | 31% | 29% | 13% | 2 |
| 15–16 Apr | YouGov | The Sun | 1,290 | 28% | 33% | 30% | 9% | 3 |
| 15 Apr | ComRes | ITV News | 4,032 | 28% | 35% | 24% | 13% | 7 |
| 14–15 Apr | ICM | The Sunday Telegraph | 1,033 | 29% | 34% | 27% | 10% | 5 |
| 14–15 Apr | YouGov | The Sun | 1,490 | 31% | 37% | 22% | 10% | 6 |
| 13–14 Apr | YouGov | The Sun | 1,578 | 32% | 41% | 18% | 9% | 9 |
| 12–13 Apr | ComRes | Multiple
ITV News The Independent |
1,001 | 29% | 35% | 21% | 15% | 6 |
| 12–13 Apr | YouGov | The Sun | 1,583 | 31% | 39% | 20% | 9% | 8 |
| 8–13 Apr | Harris Interactive | The Metro | 1,523 | 27% | 36% | 23% | 14% | 9 |
| 7–13 Apr | TNS-BMRB | N/A | 1,916 | 33% | 36% | 22% | 9% | 3 |
| 12 Apr | Dissolution of Parliament and the official start of the election campaign | |||||||
| 12 Apr | Populus | The Times | 1,525 | 33% | 36% | 21% | 9% | 3 |
| 11–12 Apr | ComRes | Multiple
ITV News The Independent |
1,002 | 31% | 36% | 19% | 14% | 5 |
| 11–12 Apr | Angus Reid Public Opinion | PoliticalBetting.com | 2,006 | 28% | 38% | 22% | 13%
UKIP on 5% BNP on 3% Greens on 2% SNP on 2% PC on 1% |
10 |
| 11–12 Apr | YouGov | The Sun | 1,493 | 33% | 39% | 20% | 8% | 6 |
| 9–12 Apr | Opinium | Daily Express | 1,825 | 31% | 39% | 17% | 13% | 8 |
| 10–11 Apr | ComRes | Multiple
ITV News The Independent |
1,004 | 30% | 37% | 20% | 13% | 7 |
| 10–11 Apr | YouGov | The Sun | 1,455 | 31% | 37% | 20% | 12% | 6 |
| 9–11 Apr | ICM | The Guardian | 1,024 | 31% | 37% | 20% | 11% | 6 |
| 9–10 Apr | YouGov | The Sunday Times | 1,431 | 32% | 40% | 18% | 10% | 8 |
| 9–10 Apr | ComRes- | Multiple
The Independent on Sunday Sunday Mirror |
1,001 | 32% | 39% | 16% | 13% | 7 |
| 8–9 Apr | YouGov | The Sun | 1,527 | 30% | 40% | 20% | 10% | 10 |
| 7–8 Apr | Harris Interactive | Daily Mail | 1,012 | 27% | 37% | 22% | 14% | 10 |
| 7–8 Apr | YouGov | The Sun | 1,626 | 31% | 40% | 18% | 11% | 9 |
| 7 Apr | ICM | The Sunday Telegraph | 1,032 | 30% | 38% | 21% | 10% | 8 |
| 6–7 Apr | YouGov | The Sun | 1,484 | 32% | 37% | 19% | 12% | 5 |
| 6–7 Apr | Angus Reid Public Opinion | PoliticalBetting.com | 2,193 | 26% | 37% | 22% | 14%
UKIP on 5% BNP on 3% Greens on 2% SNP on 2% PC on 1% Other on 1% |
11 |
| 6 Apr | Populus | The Times | 1,507 | 32% | 39% | 21% | 8% | 7 |
| 5–6 Apr | YouGov | The Sun | 1,456 | 32% | 40% | 17% | 11% | 8 |
| 31 Mar – 6 Apr | Harris Interactive | The Metro | 2,080 | 28% | 37% | 20% | 15% | 9 |
| 4–5 Apr | YouGov | The Sun | 1,620 | 31% | 41% | 18% | 11% | 10 |
| 2–5 Apr | Opinium | Daily Express | 1,903 | 29% | 39% | 17% | 15% | 10 |
| 1–3 Apr | ICM | The Guardian | 1,001 | 33% | 37% | 21% | 9% | 4 |
| 1–2 Apr | YouGov | The Sunday Times | 1,503 | 29% | 39% | 20% | 12% | 10 |
| 31 Mar – 1 Apr | Angus Reid Public Opinion | Sunday Express | 1,991 | 27% | 38% | 20% | 15%
UKIP on 5% BNP on 4% Greens on 3% |
11 |
| 31 Mar – 1 Apr | YouGov | The Sun | 1,552 | 31% | 39% | 19% | 11% | 8 |
| 30–31 Mar | ICM | The Guardian | 1,003 | 29% | 38% | 23% | 10% | 9 |
| 30–31 Mar | YouGov | The Sun | 1,615 | 32% | 38% | 19% | 11% | 6 |
| 30–31 Mar | Angus Reid Public Opinion | PoliticalBetting.com | 2,013 | 28% | 37% | 22% | 13%
UKIP on 5% BNP on 3% Greens on 2% SNP on 2% PC on 0% Other on 1% |
9 |
| 29–30 Mar | YouGov | The Sun | 1,681 | 31% | 38% | 19% | 12% | 7 |
| 24–30 Mar | TNS-BMRB | N/A | 1,819 | 33% | 38% | 19% | 10% | 5 |
| 28–29 Mar | YouGov | The Sun | 1,614 | 32% | 39% | 18% | 11% | 7 |
| 26–29 Mar | Opinium | Daily Express | 1,780 | 28% | 38% | 18% | 16% | 10 |
| 23–29 Mar | Harris Interactive | The Metro | 1,133 | 27% | 37% | 19% | 17% | 10 |
| 26–28 Mar | ComRes | The Independent | 1,001 | 30% | 37% | 20% | 13% | 7 |
| 25–26 Mar | YouGov | The Sunday Times | 1,533 | 32% | 37% | 19% | 13% | 5 |
| 24–25 Mar | ICM | News of the World | 1,003 | 31% | 39% | 19% | 11% | 8 |
| 24–25 Mar | YouGov | The Sun | 1,483 | 33% | 37% | 18% | 12% | 4 |
| 23–24 Mar | YouGov | The Sun | 1,554 | 34% | 36% | 17% | 13% | 2 |
| 22–23 Mar | YouGov | The Sun | 1,756 | 33% | 37% | 18% | 12% | 4 |
| 21–22 Mar | YouGov | The Sun | 1,560 | 32% | 36% | 20% | 12% | 4 |
| 19–22 Mar | Ipsos MORI | Daily Mirror | 1,503 | 30% | 35% | 21% | 14% | 5 |
| 19–22 Mar | Opinium | Daily Express | 1,975 | 30% | 37% | 15% | 18% | 7 |
| 17–22 Mar | Harris Interactive | The Metro | 2,117 | 28% | 35% | 17% | 20% | 7 |
| 18–19 Mar | YouGov | The Sunday Times | 1,547 | 31% | 38% | 19% | 13% | 7 |
| 17–18 Mar | ICM | News of the World | 1,002 | 32% | 38% | 19% | 10% | 6 |
| 17–18 Mar | YouGov | The Sun | 1,671 | 32% | 36% | 20% | 12% | 4 |
| 16–17 Mar | YouGov | The Sun | 1,676 | 32% | 36% | 20% | 11% | 4 |
| 15–16 Mar | Angus Reid Public Opinion | PoliticalBetting.com | 2,003 | 26% | 39% | 21% | 15%
UKIP on 5% BNP on 4% Greens on 2% SNP on 2% PC on 1% Other on 1% |
13 |
| 15–16 Mar | YouGov | The Sun | 1,460 | 32% | 37% | 19% | 12% | 5 |
| 10–16 Mar | Harris Interactive | The Metro | 1,934 | 28% | 36% | 18% | 18% | 8 |
| 14–15 Mar | YouGov | The Sun | 1,466 | 32% | 37% | 21% | 10% | 5 |
| 12–15 Mar | Opinium | Daily Express | 1,951 | 28% | 39% | 16% | 17% | 11 |
| 12–14 Mar | ICM | The Guardian | 1,002 | 31% | 40% | 20% | 9% | 9 |
| 11–12 Mar | YouGov | The Sunday Times | 1,507 | 33% | 37% | 17% | 12% | 4 |
| 10–11 Mar | ICM | The Sunday Telegraph | 1,007 | 31% | 38% | 21% | 10% | 7 |
| 10–11 Mar | YouGov | The Sun | 1,434 | 34% | 37% | 17% | 12% | 3 |
| 9–10 Mar | YouGov | The Sun | 1,473 | 32% | 37% | 17% | 14% | 5 |
| 9–10 Mar | Angus Reid Public Opinion | PoliticalBetting.com | 2,003 | 26% | 39% | 18% | 17%
UKIP on 6% BNP on 3% Greens on 3% SNP on 3% PC on 1% Other on 1% |
13 |
| 8–9 Mar | YouGov | The Sun | 1,524 | 32% | 36% | 20% | 12% | 4 |
| 7–8 Mar | YouGov | The Sun | 1,747 | 34% | 39% | 16% | 11% | 5 |
| 5–8 Mar | Opinium | Daily Express | 1,960 | 30% | 37% | 16% | 16% | 7 |
| 3–8 Mar | Harris Interactive | The Metro | 1,498 | 29% | 37% | 18% | 16% | 8 |
| 4–5 Mar | YouGov | The Sunday Times | 1,558 | 33% | 38% | 17% | 12% | 5 |
| 3–4 Mar | ICM | News of the World | 1,005 | 31% | 40% | 18% | 11% | 9 |
| 3–4 Mar | YouGov | The Sun | 1,640 | 32% | 38% | 17% | 13% | 6 |
| 2–3 Mar | YouGov | The Sun | 1,661 | 32% | 38% | 19% | 12% | 6 |
| 25 Feb – 3 Mar | TNS-BMRB | N/A | 1,973 | 31% | 39% | 19% | 11% | 8 |
| 1–2 Mar | YouGov | The Sun | 1,479 | 33% | 38% | 16% | 13% | 5 |
| 28 Feb – 1 Mar | YouGov | The Sun | 1,505 | 32% | 39% | 17% | 12% | 7 |
| 26–28 Feb | ComRes | The Independent | 1,005 | 32% | 37% | 19% | 12% | 5 |
| 25–26 Feb | YouGov | The Sunday Times | 1,436 | 35% | 37% | 17% | 11% | 2 |
| 24–25 Feb | YouGov | The Sun | 1,472 | 33% | 39% | 16% | 12% | 6 |
| 23–24 Feb | YouGov | The Sun | 1,473 | 32% | 38% | 19% | 10% | 6 |
| 18–24 Feb | TNS-BMRB | N/A | 1,954 | 32% | 36% | 21% | 12% | 4 |
| 22–23 Feb | YouGov | The Sun | 1,469 | 32% | 38% | 17% | 12% | 6 |
| 21–22 Feb | YouGov | The Sun | 1,578 | 33% | 39% | 17% | 12% | 6 |
| 19–22 Feb | Ipsos MORI | The Daily Telegraph | 1,533 | 32% | 37% | 19% | 12% | 5 |
| 16–22 Feb | Harris Interactive | The Metro | 918 | 30% | 39% | 22% | 9% | 9 |
| 19–21 Feb | ICM | The Guardian | 1,004 | 30% | 37% | 20% | 13% | 7 |
| 18–19 Feb | YouGov | The Sunday Times | 1,472 | 33% | 39% | 17% | 11% | 6 |
| 16–19 Feb | Angus Reid Public Opinion | PoliticalBetting.com | 4,004 | 26% | 38% | 19% | 16%
UKIP on 6% BNP on 4% Greens on 3% SNP on 2% PC on 1% |
12 |
| 17–18 Feb | YouGov | The Sun | 1,558 | 32% | 39% | 18% | 11% | 7 |
| 16–17 Feb | ComRes | Theos | 1,085 | 30% | 38% | 20% | 11% | 8 |
| 16–17 Feb | Angus Reid Public Opinion | PoliticalBetting.com | 2,002 | 26% | 40% | 18% | 16%
UKIP on 6% BNP on 4% Greens on 2% SNP on 2% PC on 1% Other on 1% |
14 |
| 16–17 Feb | YouGov | The Sun | 2,145 | 30% | 39% | 18% | 13% | 9 |
| 10–11 Feb | ComRes | The Independent | 1,009 | 29% | 40% | 21% | 10% | 11 |
| 9–10 Feb | Angus Reid Public Opinion | PoliticalBetting.com | 2,002 | 25% | 38% | 20% | 16%
UKIP on 6% BNP on 3% Greens on 3% SNP on 2% PC on 1% Other on 1% |
13 |
| 5–7 Feb | Populus | The Times | 1,502 | 30% | 40% | 20% | 11% | 10 |
| 3–4 Feb | ICM | The Sunday Telegraph | 1,001 | 30% | 39% | 20% | 11% | 9 |
| 29–31 Jan | ComRes | The Independent | 1,001 | 31% | 38% | 19% | 12% | 7 |
| 29–30 Jan | BPIX[2] | Mail on Sunday | 1,524 | 30% | 39% | 18% | 13% | 9 |
| 28–29 Jan | YouGov | The Daily Telegraph | 2,054 | 31% | 38% | 19% | 12% | 7 |
| 26–28 Jan | YouGov | The People | 2,044 | 31% | 40% | 18% | 11% | 9 |
| 26–28 Jan | Ipsos MORI | Daily Mirror | 1,001 | 32% | 40% | 16% | 12% | 8 |
| 26–27 Jan | Angus Reid Public Opinion | PoliticalBetting.com | 2,004 | 24% | 40% | 19% | 16%
UKIP on 5% BNP on 4% Greens on 3% SNP on 2% PC on 1% Other on 1% |
16 |
| 22–24 Jan | ICM | The Guardian | 1,000 | 29% | 40% | 21% | 10% | 11 |
| 20–21 Jan | ComRes | Sunday Mirror | 1,004 | 29% | 38% | 19% | 14% | 9 |
| 14–15 Jan | YouGov | The Sunday Times | 2,033 | 31% | 40% | 18% | 11% | 9 |
| 13–14 Jan | ComRes | The Independent on Sunday | 1,005 | 29% | 42% | 19% | 10% | 13 |
| 9–10 Jan | Angus Reid Strategies | PoliticalBetting.com | 2,010 | 24% | 40% | 20% | 17% | 16 |
| 8–10 Jan | Populus | The Times | 1,509 | 28% | 41% | 19% | 12% | 13 |
| 6–7 Jan | ICM | The Sunday Telegraph | 1,003 | 30% | 40% | 18% | 12% | 10 |
| 6–7 Jan | YouGov | The Sun | 2,832 | 30% | 42% | 16% | 12% | 12 |
| 5–6 Jan | YouGov | The Sun | 4,167 | 31% | 40% | 17% | 12% | 9 |
2009
| Date(s) Conducted |
Pollster | Client | Sample size |
Lab | Con | LD | Others | Lead |
|---|---|---|---|---|---|---|---|---|
| 29–30 Dec | YouGov | The Daily Telegraph | 1,848 | 30% | 40% | 17% | 12% | 10 |
| 19–20 Dec | ComRes | The Independent | 1,006 | 29% | 38% | 19% | 14% | 9 |
| 16–18 Dec | Angus Reid Strategies | PoliticalBetting.com | 2,010 | 24% | 40% | 20% | 15%
UKIP on 6% BNP on 3% Greens on 3% SNP on 1% PC on 1% Other on 1% |
16 |
| 15–17 Dec | YouGov | The People | 2,052 | 28% | 40% | 18% | 14% | 12 |
| 11–13 Dec | ICM | The Guardian | 1,009 | 31% | 40% | 18% | 11% | 9 |
| 11–13 Dec | Ipsos MORI | The Observer | 1,017 | 26% | 43% | 20% | 12% | 17 |
| 10–11 Dec | YouGov | The Sunday Times | 2,044 | 31% | 40% | 16% | 13% | 9 |
| 9–10 Dec | ComRes Archived 11 December 2024 at the Wayback Machine | The Independent on Sunday | 1,001 | 24% | 41% | 21% | 14% | 17 |
| 8–10 Dec | Angus Reid Strategies | PoliticalBetting.com | 2,002 | 23% | 40% | 19% | 19%
UKIP on 7% BNP on 4% Greens on 3% SNP on 3% PC on 1% Other on 1% |
17 |
| 4–6 Dec | Populus | The Times | 1,505 | 30% | 38% | 20% | 12% | 8 |
| 3–4 Dec | YouGov | The Sunday Times | 2,095 | 27% | 40% | 18% | 15% | 13 |
| 2–3 Dec | ICM | The Sunday Telegraph | 1,001 | 29% | 40% | 19% | 12% | 11 |
| 27–29 Nov | ComRes | The Independent | 1,003 | 27% | 37% | 20% | 16% | 10 |
| 24–26 Nov | YouGov | The Daily Telegraph | 2,004 | 29% | 39% | 19% | 13% | 10 |
| 20–23 Nov | Angus Reid Strategies | PoliticalBetting.com | 2,004 | 22% | 39% | 21% | 18%
UKIP on 6% BNP on 5% Greens on 3% SNP on 2% PC on 1% Other on 1% |
17 |
| 13–15 Nov | Ipsos MORI | The Observer | 1,006 | 31% | 37% | 17% | 13% | 6 |
| 13–15 Nov | ICM | The Guardian | 1,010 | 29% | 42% | 19% | 10% | 13 |
| 12–13 Nov | YouGov | The Sunday Times | 2,026 | 27% | 41% | 18% | 14% | 14 |
| 11–12 Nov | ComRes | The Independent on Sunday | 1,007 | 25% | 39% | 17% | 19% | 14 |
| 6–8 Nov | Populus | The Times | 1,504 | 29% | 39% | 18% | 14% | 10 |
| 4–6 Nov | Angus Reid Strategies | PoliticalBetting.com | 2,000 | 24% | 38% | 20% | 17% | 14 |
| 4–5 Nov | YouGov | Channel 4 News | 1,021 | 27% | 41% | 17% | 16% | 14 |
| 28–29 Oct | ICM | The Sunday Telegraph | 1,007 | 25% | 42% | 21% | 13% | 17 |
| 27–29 Oct | YouGov | The Daily Telegraph | 2,024 | 28% | 41% | 16% | 15% | 13 |
| 23–25 Oct | ComRes | The Independent | 1,004 | 27% | 40% | 18% | 15% | 13 |
| 22–23 Oct | YouGov | The Daily Telegraph | 1,314 | 27% | 40% | 19% | 14% | 13 |
| 16–18 Oct | ICM | The Guardian | 1,002 | 27% | 44% | 18% | 11% | 17 |
| 16–18 Oct | Ipsos MORI | N/A | 996 | 26% | 43% | 19% | 11% | 17 |
| 15–16 Oct | Angus Reid Strategies | PoliticalBetting.com | 2,077 | 23% | 40% | 20% | 15% | 17 |
| 15–16 Oct | YouGov | The Sunday Times | 2,025 | 30% | 41% | 17% | 12% | 11 |
| 14–15 Oct | ComRes | The Independent on Sunday | 1,008 | 28% | 40% | 19% | 13% | 12 |
| 9–11 Oct | Populus | The Times | 1,509 | 30% | 40% | 18% | 12% | 10 |
| 8–9 Oct | YouGov | The Sun | 2,161 | 28% | 42% | 18% | 12% | 14 |
| 8–9 Oct | YouGov | Sky News | 1,064 | 27% | 44% | 17% | 12% | 17 |
| 7–9 Oct | ICM | News of the World | 1,008 | 26% | 45% | 18% | 10% | 19 |
| 7–8 Oct | YouGov | Sky News | 1,074 | 31% | 40% | 18% | 11% | 9 |
| 6–7 Oct | YouGov | Sky News | 1,039 | 29% | 43% | 17% | 11% | 14 |
| 5–6 Oct | YouGov | Sky News | 1,223 | 28% | 41% | 18% | 13% | 13 |
| 4–5 Oct | YouGov | Sky News | 1,102 | 27% | 40% | 20% | 13% | 13 |
| 3 Oct | YouGov | The People | 2,027 | 28% | 40% | 18% | 14% | 12 |
| 1–2 Oct | YouGov | Sky News | 1,053 | 29% | 41% | 17% | 13% | 12 |
| 30 Sep – 1 Oct | ComRes | The Independent on Sunday | 1,022 | 28% | 40% | 19% | 13% | 12 |
| 30 Sep – 1 Oct | YouGov | Sky News | 1,085 | 26% | 40% | 20% | 15% | 14 |
| 29–30 Sep | YouGov | Sky News | 1,078 | 30% | 37% | 21% | 12% | 7 |
| 28–29 Sep | YouGov | Sky News | 1,024 | 29% | 40% | 18% | 13% | 11 |
| 27–28 Sep | YouGov | Sky News | 1,051 | 29% | 39% | 20% | 13% | 10 |
| 25–27 Sep | Ipsos MORI | N/A | 1,003 | 24% | 36% | 25% | 15% | 11 |
| 25–27 Sep | ComRes | The Independent | 1,003 | 23% | 38% | 23% | 16% | 15 |
| 24–25 Sep | YouGov | Sky News | 1,059 | 24% | 40% | 21% | 14% | 16 |
| 23–24 Sep | YouGov | Sky News | 1,057 | 25% | 38% | 23% | 14% | 13 |
| 23–24 Sep | ICM | News of the World | 1,003 | 26% | 40% | 23% | 11% | 14 |
| 22–24 Sep | YouGov | The Daily Telegraph | 2,026 | 26% | 39% | 20% | 15% | 13 |
| 22–23 Sep | YouGov | Sky News | 1,036 | 28% | 38% | 19% | 15% | 10 |
| 21–22 Sep | YouGov | Sky News | 1,062 | 27% | 39% | 20% | 13% | 12 |
| 20–21 Sep | YouGov | Sky News | 1,081 | 30% | 39% | 17% | 14% | 9 |
| 18–20 Sep | ICM | The Guardian | 1,001 | 26% | 43% | 19% | 12% | 17 |
| 11–13 Sep | Populus | The Times | 1,506 | 27% | 41% | 18% | 14% | 14 |
| 10–11 Sep | YouGov | The Sunday Times | 2,009 | 27% | 41% | 17% | 15% | 14 |
| 4–6 Sep | ComRes | The Independent | 1,005 | 24% | 40% | 21% | 15% | 16 |
| 4–6 Sep | YouGov | The Daily Telegraph | 1,573 | 27% | 40% | 18% | 15% | 13 |
| 27–28 Aug | YouGov | The Sun | 1,996 | 28% | 42% | 17% | 14% | 14 |
| 25–27 Aug | YouGov | The Daily Telegraph | 2,199 | 26% | 42% | 18% | 14% | 16 |
| 21–23 Aug | Ipsos MORI | N/A | 1,013 | 26% | 43% | 17% | 13% | 17 |
| 21–23 Aug | ICM | The Guardian | 1,004 | 25% | 41% | 19% | 14% | 16 |
| 19–20 Aug | ComRes | The Independent on Sunday | 1,013 | 24% | 41% | 18% | 16% | 17 |
| 13–14 Aug | YouGov | The Sunday Times | 2,007 | 28% | 42% | 18% | 13% | 14 |
| 12–13 Aug | ICM/Sunday Mirror | Sunday Mirror | 1,005 | 26% | 43% | 19% | 12% | 17 |
| 28–30 Jul | YouGov | The Daily Telegraph | 2,334 | 27% | 41% | 18% | 15% | 14 |
| 24–26 Jul | ComRes | The Independent | 1,008 | 24% | 42% | 18% | 16% | 18 |
| 21–23 Jul | YouGov | The People | 2,218 | 25% | 40% | 20% | 16% | 15 |
| 17–19 Jul | Ipsos MORI | N/A | 1,012 | 24% | 40% | 18% | 18% | 16 |
| 17–19 Jul | Populus | The Times | 1,504 | 26% | 38% | 20% | 16% | 12 |
| 16–17 Jul | YouGov | The Sunday Times | 1,956 | 25% | 42% | 18% | 15% | 17 |
| 15–16 Jul | ComRes | The Independent on Sunday | 1,010 | 23% | 38% | 22% | 16% | 15 |
| 10–11 Jul | ICM | The Guardian | 1,000 | 27% | 41% | 20% | 12% | 14 |
| 1–3 Jul | YouGov | Fabian Society | 2,001 | 26% | 39% | 19% | 17% | 13 |
| 26–28 Jun | ComRes | The Independent | 1,007 | 25% | 36% | 19% | 20% | 11 |
| 24–26 Jun | YouGov | The People | 2,017 | 24% | 40% | 17% | 19% | 16 |
| 23–25 Jun | YouGov | The Daily Telegraph | 2,233 | 25% | 38% | 18% | 19% | 13 |
| 19–21 Jun | Ipsos MORI | N/A | 1,004 | 21% | 38% | 19% | 23% | 17 |
| 17–18 Jun | ComRes | The Independent on Sunday | 1,012 | 22% | 39% | 18% | 21% | 17 |
| 10–17 Jun | Harris Interactive | The Metro | 2,081 | 20% | 35% | 16% | 29% | 15 |
| 12–14 Jun | Ipsos MORI | UNISON | 1,252 | 25% | 39% | 19% | 17% | 14 |
| 12–14 Jun | ICM | The Guardian | 1,006 | 27% | 39% | 18% | 15% | 12 |
| 11–12 Jun | YouGov | The Sunday Times | 1,902 | 24% | 40% | 18% | 19% | 16 |
| 9–10 Jun | Populus | The Times | 1,001 | 24% | 36% | 19% | 21% | 12 |
| 5–7 Jun | ComRes | The Independent | 1,001 | 22% | 38% | 20% | 20% | 16 |
| 2–3 Jun | YouGov | The Daily Telegraph | 4,014 | 21% | 37% | 19% | 23% | 16 |
| 29–31 May | ComRes | The Independent | 1,005 | 22% | 30% | 18% | 30% | 8 |
| 29–31 May | Ipsos MORI | 1,001 | 18% | 40% | 18% | 24% | 22 | |
| 27–29 May | YouGov | The Daily Telegraph | 5,016 | 22% | 39% | 18% | 21% | 17 |
| 27–28 May | ICM Archived 3 March 2012 at the Wayback Machine | The Sunday Telegraph | 1,013 | 22% | 40% | 25% | 13% | 15 |
| 27–28 May | Populus | The Times | 1,001 | 21% | 41% | 15% | 23% | 20 |
| 19–20 May | Populus | ITV News | 1,000 | 27% | 39% | 17% | 18% | 12 |
| 15–17 May | ICM | The Guardian | 1,002 | 28% | 39% | 20% | 14% | 11 |
| 14–16 May | YouGov | The Daily Telegraph | 2,235 | 23% | 39% | 19% | 19% | 16 |
| 13–14 May | ComRes | The Independent on Sunday | 1,010 | 21% | 40% | 18% | 21% | 19 |
| 13–14 May | YouGov | The Sun | 1,814 | 22% | 41% | 19% | 18% | 19 |
| 8–10 May | Populus | The Times | 1,504 | 26% | 39% | 22% | 13% | 13 |
| 8–9 May | BPIX[2] | Mail on Sunday | Unknown[2] | 23% | 45% | 17% | 15% | 22 |
| 7–8 May | YouGov | The Sunday Times | 2,209 | 27% | 43% | 18% | 12% | 16 |
| 24–26 Apr | ComRes | The Independent | 1,003 | 26% | 45% | 17% | 12% | 19 |
| 23–24 Apr | YouGov/Sunday People | Sunday People | 1,855 | 27% | 45% | 17% | 12% | 18 |
| 22–23 Apr | YouGov | The Daily Telegraph | 1,896 | 27% | 45% | 18% | 10% | 18 |
| 17–19 Apr | Ipsos MORI | N/A | 1,011 | 28% | 41% | 22% | 9% | 13 |
| 17–19 Apr | ICM | The Guardian | 1,005 | 30% | 40% | 19% | 11% | 10 |
| 15–16 Apr | Marketing Sciences | The Sunday Telegraph | 1,007 | 26% | 43% | 21% | 10% | 17 |
| 3–5 Apr | Populus | The Times | 1,512 | 30% | 43% | 18% | 9% | 13 |
| 3–4 Apr | YouGov | The Sunday Times | 2,125 | 34% | 41% | 16% | 10% | 7 |
| 27–29 Mar | ComRes | The Independent | 1,002 | 28% | 40% | 18% | 14% | 12 |
| 25–26 Mar | ICM | The Sunday Telegraph | 1,003 | 31% | 44% | 18% | 8% | 13 |
| 24–26 Mar | YouGov | The Daily Telegraph | 2,104 | 31% | 41% | 17% | 11% | 10 |
| 18–19 Mar | ComRes | The Independent on Sunday | 1,002 | 30% | 41% | 17% | 12% | 11 |
| 13–15 Mar | ICM | The Guardian | 1,004 | 30% | 42% | 20% | 8% | 12 |
| 13–15 Mar | Ipsos MORI | N/A | 1,007 | 32% | 42% | 14% | 11% | 10 |
| 12–13 Mar | YouGov | The Sunday Times | 1,840 | 31% | 41% | 17% | 11% | 10 |
| 6–8 Mar | Populus | The Times | 1,504 | 30% | 42% | 19% | 9% | 12 |
| 27 Feb – 1 Mar | ComRes | The Independent | 1,006 | 28% | 44% | 17% | 12% | 16 |
| 24–26 Feb | YouGov | The Daily Telegraph | 2,063 | 31% | 41% | 15% | 12% | 10 |
| 20–22 Feb | ICM | The Guardian | 1,004 | 30% | 42% | 18% | 10% | 12 |
| 13–15 Feb | Ipsos MORI | N/A | 1,001 | 28% | 48% | 17% | 7% | 20 |
| 12–13 Feb | YouGov | The Sunday Times | 1,711 | 32% | 44% | 14% | 10% | 12 |
| 11–12 Feb | ComRes | The Independent on Sunday | 1,002 | 25% | 41% | 22% | 12% | 16 |
| 6–8 Feb | Populus | The Times | 1,504 | 28% | 42% | 18% | 12% | 14 |
| 4–5 Feb | ICM | The Sunday Telegraph | 1,010 | 28% | 40% | 22% | 10% | 12 |
| 27–29 Jan | YouGov | The Daily Telegraph | 2,338 | 32% | 43% | 16% | 10% | 11 |
| 23–25 Jan | ICM | The Guardian | 1,003 | 32% | 44% | 16% | 8% | 12 |
| 21–22 Jan | ComRes | The Independent | 1,012 | 28% | 43% | 16% | 13% | 15 |
| 16–18 Jan | Ipsos MORI | N/A | 1,005 | 30% | 44% | 17% | 9% | 14 |
| 15–16 Jan | YouGov | The Sunday Times | 2,077 | 32% | 45% | 14% | 9% | 13 |
| 14–15 Jan | ComRes | The Independent on Sunday | 1,009 | 32% | 41% | 15% | 12% | 9 |
| 9–11 Jan | Populus | The Times | 1,500 | 33% | 43% | 15% | 9% | 10 |
| 7–8 Jan | YouGov | The Sun | 1,835 | 34% | 41% | 15% | 10% | 7 |
2008
| Date(s) Conducted |
Pollster | Client | Sample size |
Lab | Con | LD | Others | Lead |
|---|---|---|---|---|---|---|---|---|
| 19–21 Dec | ComRes | The Independent | 1,000 | 34% | 39% | 16% | 11% | 5 |
| 16–18 Dec | YouGov | The Daily Telegraph | 2,241 | 35% | 42% | 14% | 9% | 7 |
| 12–14 Dec | Ipsos MORI | N/A | 1,000 | 35% | 39% | 15% | 11% | 4 |
| 12–14 Dec | ICM | The Guardian | 1,003 | 33% | 38% | 19% | 10% | 5 |
| 11–12 Dec | YouGov | The Sunday Times | 2,098 | 35% | 41% | 15% | 10% | 6 |
| 10–11 Dec | ComRes | The Independent on Sunday | 1,003 | 36% | 37% | 14% | 12% | 1 |
| 10–11 Dec | Ipsos MORI | N/A | 1,007 | 36% | 41% | 11% | 12% | 5 |
| 5–7 Dec | Populus | The Times | 1,505 | 35% | 39% | 17% | 9% | 4 |
| 28–30 Nov | ComRes | The Independent | 1,005 | 36% | 37% | 17% | 10% | 1 |
| 27–28 Nov | Ipsos MORI | The Observer | 1,017 | 32% | 43% | 15% | 10% | 11 |
| 25–26 Nov | ICM | The Guardian | 1,027 | 30% | 45% | 18% | 7% | 15 |
| 24–25 Nov | YouGov | The Daily Telegraph | 1,556 | 36% | 40% | 14% | 10% | 4 |
| 19–20 Nov | ICM | Sunday Mirror | 1,010 | 31% | 42% | 19% | 8% | 11 |
| 14–16 Nov | Ipsos MORI | N/A | 1,002 | 37% | 40% | 12% | 11% | 3 |
| 13–14 Nov | YouGov | The Sunday Times | 2,080 | 36% | 41% | 14% | 10% | 5 |
| 12–13 Nov | ComRes | The Independent on Sunday | 1,010 | 32% | 43% | 12% | 13% | 11 |
| 7–9 Nov | Populus | The Times | 1,503 | 35% | 41% | 16% | 8% | 6 |
| 5–6 Nov | ICM | The Sunday Telegraph | 1,005 | 30% | 43% | 18% | 9% | 13 |
| 2 Nov | BPIX[2] | N/A | ? | 31% | 45% | 13% | 11% | 14 |
| 27–29 Oct | YouGov | The Daily Telegraph | 2,271 | 33% | 42% | 15% | 10% | 9 |
| 24–26 Oct | ComRes | The Independent | 1,001 | 31% | 39% | 16% | 14% | 8 |
| 17–19 Oct | Ipsos MORI | N/A | 1,004 | 30% | 45% | 14% | 11% | 15 |
| 17–19 Oct | ICM | The Guardian | 1,007 | 30% | 42% | 21% | 7% | 12 |
| 16–18 Oct | BPIX[2] | N/A | 2,046 | 30% | 46% | 13% | 11% | 16 |
| 15–17 Oct | YouGov | The Daily Mirror | 2,029 | 34% | 42% | 14% | 10% | 8 |
| 15–16 Oct | ComRes | The Independent on Sunday | 1,005 | 31% | 40% | 16% | 14% | 9 |
| 9–10 Oct | YouGov | The Sunday Times | 1,941 | 33% | 43% | 14% | 10% | 10 |
| 3–5 Oct | Populus | The Times | 1,503 | 30% | 45% | 15% | 10% | 15 |
| 1–3 Oct | YouGov | The Daily Telegraph | 2,048 | 31% | 45% | 15% | 9% | 14 |
| 26–28 Sep | ComRes | The Independent | 1,017 | 29% | 41% | 18% | 12% | 12 |
| 24–26 Sep | BPIX[2] | N/A | 2,020 | 31% | 43% | 17% | 9% | 12 |
| 24–25 Sep | ICM | The Guardian | 1,012 | 32% | 41% | 18% | 9% | 9 |
| 23–24 Sep | YouGov | The Sun | 1,536 | 31% | 41% | 16% | 12% | 10 |
| 17–18 Sep | ComRes | The Independent on Sunday | 1,010 | 27% | 39% | 21% | 12% | 12 |
| 17–19 Sep | YouGov | The Daily Telegraph | 2,227 | 24% | 44% | 20% | 12% | 20 |
| 12–14 Sep | Ipsos MORI | N/A | 1,017 | 24% | 52% | 12% | 12% | 28 |
| 10–12 Sep | YouGov | The Sunday Times | 2,161 | 27% | 46% | 16% | 11% | 19 |
| 3–4 Sep | ComRes | The Independent | 1,013 | 25% | 44% | 17% | 14% | 19 |
| 29–31 Aug | Populus | The Times | 1,506 | 27% | 43% | 18% | 12% | 16 |
| 26–27 Aug | YouGov | The Daily Telegraph | 2,267 | 26% | 45% | 16% | 13% | 19 |
| 20–21 Aug | ComRes | The Independent | 1,014 | 25% | 46% | 16% | 13% | 21 |
| 15–17 Aug | ICM | The Guardian | 1,002 | 29% | 44% | 19% | 8% | 15 |
| 15–17 Aug | Ipsos MORI | N/A | 1,005 | 24% | 48% | 16% | 12% | 24 |
| 14–15 Aug | YouGov | The Sunday Times | 1,745 | 25% | 45% | 18% | 12% | 20 |
| 6–8 Aug | YouGov | News of the World | 2,031 | 26% | 46% | 17% | 11% | 20 |
| 31 Jul – 2 Aug | BPIX[2] | N/A | 1,333 | 24% | 47% | 16% | 13% | 23 |
| 30 Jul – 1 Aug | ICM | Sunday Express | 1,001 | 29% | 45% | 16% | 10% | 16 |
| 29–31 Jul | YouGov | The Daily Telegraph | 1,949 | 25% | 47% | 16% | 12% | 22 |
| 25–27 Jul | Populus | The Times | 1,002 | 27% | 43% | 18% | 12% | 16 |
| 23–25 Jul | YouGov | The Daily Telegraph | 2,120 | 26% | 45% | 17% | 12% | 19 |
| 23–24 Jul | ComRes | The Independent | 1,021 | 24% | 46% | 18% | 12% | 22 |
| 18–20 Jul | Ipsos MORI | N/A | 1,016 | 27% | 47% | 15% | 11% | 20 |
| 18–20 Jul | ICM | The Guardian | 1,007 | 28% | 43% | 19% | 10% | 15 |
| 16–17 Jul | ComRes | The Independent on Sunday | 1,016 | 24% | 45% | 16% | 15% | 21 |
| 10–11 Jul | YouGov | The Sunday Times | 1,832 | 25% | 47% | 16% | 12% | 22 |
| 10 Jul | Haltemprice and Howden by-election (Con hold) | |||||||
| 4–6 Jul | Populus | The Times | 1,507 | 28% | 41% | 19% | 12% | 13 |
| 25–26 Jun | ComRes | The Independent | 1,007 | 25% | 46% | 18% | 11% | 21 |
| 23–25 Jun | YouGov | The Daily Telegraph | 2,163 | 28% | 46% | 15% | 11% | 18 |
| 20–22 Jun | ICM | The Guardian | 1,000 | 25% | 45% | 20% | 10% | 20 |
| 18–20 Jun | BPIX[2] | N/A | 2,385 | 26% | 49% | 14% | 11% | 23 |
| 13–15 Jun | Ipsos MORI | N/A | 1,012 | 28% | 45% | 16% | 11% | 17 |
| 11–12 Jun | ComRes | The Independent on Sunday | 1,012 | 26% | 44% | 17% | 13% | 18 |
| 12–13 Jun | YouGov | The Sunday Times | 1,769 | 25% | 47% | 18% | 10% | 22 |
| 6–8 Jun | Populus | The Times | 1,508 | 25% | 45% | 20% | 10% | 20 |
| 4–5 Jun | ICM | The Sunday Telegraph | 1,023 | 26% | 42% | 21% | 11% | 16 |
| 30 May – 1 Jun | ComRes | The Independent | 1,006 | 30% | 44% | 16% | 10% | 14 |
| 27–29 May | YouGov | The Daily Telegraph | 2,241 | 23% | 47% | 18% | 12% | 24 |
| 16–18 May | ICM | The Guardian | 1,008 | 27% | 41% | 22% | 10% | 14 |
| 15–16 May | YouGov | The Sunday Times | 1,854 | 25% | 45% | 18% | 12% | 20 |
| 14–15 May | ComRes | The Independent on Sunday | 1,004 | 26% | 43% | 19% | 12% | 17 |
| 7–8 May | YouGov | The Sun | 1,571 | 23% | 49% | 17% | 11% | 26 |
| 2–4 May | Populus | The Times | 1,509 | 29% | 40% | 19% | 11% | 11 |
| 25–27 Apr | ComRes | The Independent | 1,005 | 26% | 40% | 20% | 14% | 14 |
| 23–24 Apr | ICM | The Sunday Telegraph | 1,010 | 29% | 39% | 20% | 12% | 10 |
| 21–23 Apr | YouGov | The Daily Telegraph | 2,073 | 26% | 44% | 17% | 13% | 18 |
| 17–22 Apr | Ipsos-MORI | The Observer | 1,059 | 31% | 40% | 19% | 10% | 9 |
| 18–20 Apr | ICM/The Gurdian | N/A | 1,000 | 34% | 39% | 19% | 8% | 5 |
| 16–17 Apr | Populus | Sunday Mirror | 1,006 | 30% | 40% | 19% | 11% | 10 |
| 10–11 Apr | YouGov | The Sunday Times | 1,755 | 28% | 44% | 17% | 11% | 16 |
| 8–10 Apr | Populus | The Times | 1,502 | 33% | 39% | 17% | 6% | 6 |
| 2–3 Apr | ICM | The Sunday Telegraph | 1,010 | 32% | 43% | 18% | 7% | 11 |
| 28–30 Mar | ComRes | The Independent | 1,004 | 31% | 38% | 17% | 14% | 7 |
| 25–27 Mar | YouGov | The Daily Telegraph | 1,926 | 29% | 43% | 17% | 11% | 14 |
| 13–18 Mar | Ipsos MORI | N/A | 1,983 | 35% | 40% | 18% | 7% | 5 |
| 14–16 Mar | ICM | The Guardian | 1,003 | 29% | 42% | 21% | 8% | 13 |
| 13–14 Mar | YouGov | The Sunday Times | 2,311 | 27% | 43% | 16% | 13% | 16 |
| 12–13 Mar | ICM | News of the World | 1,002 | 31% | 40% | 20% | 9% | 9 |
| 7–9 Mar | Populus | The Times | 1,502 | 34% | 37% | 19% | 10% | 3 |
| 25–27 Feb | YouGov | The Daily Telegraph | 2,011 | 33% | 40% | 16% | 11% | 7 |
| 21–26 Feb | Ipsos MORI | N/A | 2,063 | 37% | 39% | 16% | 8% | 2 |
| 22–24 Feb | ComRes | The Independent | 1,010 | 30% | 41% | 17% | 12% | 11 |
| 18–20 Feb | YouGov/The Economist | The Economist | 2,118 | 34% | 40% | 16% | 11% | 6 |
| 15–17 Feb | ICM | The Guardian | 1,003 | 34% | 37% | 21% | 8% | 3 |
| 14–15 Feb | YouGov | The Sunday Times | 2,469 | 32% | 41% | 16% | 11% | 9 |
| 1–3 Feb | Populus | The Times | 1,504 | 31% | 40% | 17% | 12% | 9 |
| 30–31 Jan | ICM | The Sunday Telegraph | 1,012 | 32% | 37% | 21% | 10% | 5 |
| 25–27 Jan | ComRes | The Independent | 1,003 | 30% | 38% | 17% | 15% | 8 |
| 21–23 Jan | YouGov | The Daily Telegraph | 1,992 | 33% | 41% | 16% | 10% | 8 |
| 17–22 Jan | Ipsos MORI | N/A | 2,045 | 38% | 37% | 16% | 9% | 1 |
| 18–20 Jan | ICM | The Guardian | 1,009 | 35% | 37% | 20% | 8% | 2 |
| 10–11 Jan | YouGov | The Sunday Times | 2,139 | 33% | 43% | 14% | 11% | 10 |
| 9–10 Jan | ICM | The Sunday Telegraph | 1,011 | 33% | 40% | 18% | 9% | 7 |
| 9–10 Jan | Ipsos MORI | The Sun | 1,006 | 32% | 42% | 15% | 11% | 10 |
| 4–6 Jan | Populus | The Times | 1,509 | 33% | 37% | 19% | 11% | 4 |
2007
| Date(s) Conducted |
Pollster | Client | Sample size |
Lab | Con | LD | Others | Lead |
|---|---|---|---|---|---|---|---|---|
| 18–19 Dec | ICM | The Guardian | 1,034 | 34% | 39% | 18% | 9% | 5 |
| 17–19 Dec | YouGov | The Daily Telegraph | 2,060 | 31% | 43% | 16% | 11% | 12 |
| 14–16 Dec | ComRes | The Independent | 1,004 | 30% | 41% | 16% | 12% | 11 |
| 13–14 Dec | YouGov | The Sunday Times | 1,481 | 32% | 45% | 14% | 10% | 13 |
| 7–9 Dec | Populus | The Times | 1,506 | 32% | 40% | 16% | 11% | 8 |
| 29 Nov – 7 Dec | Ipsos MORI | N/A | 1,859 | 35% | 42% | 14% | 9% | 7 |
| 28–29 Nov | ICM | News of the World | 1,011 | 30% | 41% | 19% | 10% | 11 |
| 26–29 Nov | YouGov | The Daily Telegraph | 4,004 | 32% | 43% | 14% | 11% | 11 |
| 23–27 Nov | Ipsos MORI | N/A | 1,933 | 32% | 41% | 17% | 10% | 9 |
| 23–25 Nov | ComRes | The Independent | 1,009 | 27% | 41% | 18% | 15% | 13 |
| 21–22 Nov | ICM | The Guardian | 1,005 | 31% | 37% | 21% | 10% | 6 |
| 21–22 Nov | YouGov | Channel 4 News | 1,600 | 32% | 41% | 14% | 13% | 9 |
| 14–16 Nov | YouGov | The Sunday Times | 1,983 | 35% | 41% | 13% | 11% | 6 |
| 8–10 Nov | ICM | Sunday Express | 1,001 | 35% | 43% | 15% | 7% | 8 |
| 2–4 Nov | Populus | The Times | 1,503 | 37% | 36% | 16% | 11% | 1 |
| 31 Oct – 1 Nov | Ipsos MORI | The Sun | 1,013 | 35% | 40% | 13% | 12% | 5 |
| 26–28 Oct | ICM | The Guardian | 1,011 | 35% | 40% | 18% | 7% | 5 |
| 26–28 Oct | ComRes | The Independent | 1,002 | 33% | 42% | 15% | 10% | 8 |
| 22–24 Oct | YouGov | The Daily Telegraph | 2,105 | 38% | 41% | 11% | 10% | 3 |
| 18–23 Oct | Ipsos MORI | The Observer | 1,987 | 41% | 40% | 13% | 6% | 1 |
| 10–11 Oct | ICM | The Sunday Telegraph | 1,010 | 36% | 43% | 14% | 8% | 7 |
| 10 Oct | Ipsos MORI | The Sun | 1,007 | 38% | 41% | 11% | 10% | 3 |
| 5–6 Oct | YouGov | The Sunday Times | 1,757 | 38% | 41% | 11% | 10% | 3 |
| 5–7 Oct | Populus | The Times | 1,008 | 40% | 38% | 12% | 10% | 2 |
| 3–4 Oct | YouGov | Channel 4 News | 1,741 | 40% | 36% | 13% | 11% | 4 |
| 3–4 Oct | ICM | The Guardian | 38% | 38% | 16% | 8% | Tie | |
| 2–3 Oct | Populus | The Times | 1,000 | 39% | 36% | 15% | 10% | 3 |
| 26–28 Sep | YouGov | The Daily Telegraph | 2,165 | 43% | 32% | 15% | 10% | 11 |
| 27–28 Sep | Ipsos MORI | The Observer | 1,000 | 41% | 34% | 16% | 9% | 7 |
| 26–27 Sep | Populus | The Times | 1,002 | 41% | 31% | 17% | 10% | 10 |
| 20–26 Sep | Ipsos MORI | N/A | 1,964 | 44% | 31% | 15% | 10% | 13 |
| 24–25 Sep | YouGov | Channel 4 News | 1,341 | 44% | 33% | 13% | 11% | 11 |
| 20–22 Sep | Ipsos MORI | The Sun | 1,009 | 42% | 34% | 14% | 10% | 8 |
| 19–21 Sep | YouGov | The Daily Telegraph | 2,085 | 39% | 33% | 16% | 12% | 6 |
| 19–20 Sep | ICM | Sunday Mirror | 1,029 | 39% | 33% | 19% | 9% | 6 |
| 13–16 Sep | ICM | The Guardian | 1,005 | 40% | 32% | 20% | 8% | 8 |
| 13–14 Sep | YouGov | The Sunday Times | 1,942 | 39% | 34% | 15% | 12% | 5 |
| 11–12 Sep | ComRes | The Independent | 1,005 | 37% | 34% | 15% | 14% | 3 |
| 31 Aug – 2 Sep | Populus | The Times | 1,506 | 37% | 36% | 18% | 9% | 1 |
| 29–31 Aug | YouGov | GMTV | 2,154 | 38% | 35% | 15% | 12% | 3 |
| 29–30 Aug | ComRes | The Independent | 1,016 | 35% | 36% | 14% | 14% | 1 |
| 23–29 Aug | Ipsos MORI | The Sun | 1,941 | 41% | 36% | 16% | 7% | 5 |
| 25–28 Aug | Populus | Conservative Party | 530 | 37% | 36% | 16% | 10% | 1 |
| 24–28 Aug | YouGov | The Daily Telegraph | 2,266 | 41% | 33% | 14% | 12% | 8 |
| 22–23 Aug | ICM | The Guardian | 1,016 | 39% | 34% | 18% | 9% | 5 |
| 9–10 Aug | YouGov | The Sunday Times | 1,966 | 42% | 32% | 14% | 12% | 10 |
| 8–10 Aug | ICM | Sunday Mirror | 1,007 | 39% | 33% | 18% | 10% | 6 |
| 8–9 Aug | Ipsos MORI | The Sun | 531 | 38% | 33% | 15% | 14% | 5 |
| 27–29 Jul | Populus | The Times | 1,511 | 39% | 33% | 15% | 13% | 6 |
| 27–29 Jul | Communicate | The Independent | 1,006 | 37% | 34% | 16% | 14% | 3 |
| 23–25 Jul | YouGov | The Daily Telegraph | 1,877 | 41% | 32% | 16% | 11% | 9 |
| 20–22 Jul | ICM | The Guardian | 1,005 | 38% | 32% | 20% | 10% | 6 |
| 19–20 Jul | YouGov | The Sunday Times | 1,664 | 40% | 33% | 15% | 12% | 7 |
| 19 Jul | Ealing Southall by-election and Sedgefield by-election (both Lab holds) | |||||||
| 12–17 Jul | Ipsos MORI | The Observer | 1,919 | 41% | 35% | 15% | 9% | 6 |
| 4–5 Jul | ICM | Sunday Mirror | 1,006 | 37% | 35% | 17% | 10% | 2 |
| 1 Jul | Populus | The Times | 1,504 | 37% | 34% | 18% | 11% | 3 |
| 28–29 Jun | YouGov | The Daily Telegraph | 1,886 | 38% | 35% | 15% | 12% | 3 |
| 27–28 Jun | ICM | The Guardian | 1,005 | 39% | 35% | 18% | 8% | 4 |
| 22–24 Jun | Communicate | The Independent | 1,005 | 32% | 37% | 18% | 13% | 5 |
| 14–20 Jun | Ipsos MORI | The Observer | 1,970 | 39% | 36% | 15% | 10% | 3 |
| 14–15 Jun | YouGov | The Sunday Times | 1,753 | 35% | 37% | 14% | 14% | 2 |
| 1–3 Jun | Populus | N/A | 1,503 | 33% | 36% | 17% | 14% | 3 |
| 30–31 May | ICM | The Sunday Telegraph | 1,014 | 32% | 37% | 21% | 10% | 5 |
| 25–28 May | Communicate | The Independent | 1,003 | 31% | 35% | 19% | 15% | 4 |
| 21–23 May | YouGov | The Daily Telegraph | 2,050 | 33% | 39% | 15% | 13% | 6 |
| 18–20 May | ICM | The Guardian | 1,003 | 32% | 34% | 21% | 12% | 2 |
| 11–13 May | Populus | The Times | 1,504 | 33% | 37% | 17% | 13% | 4 |
| 10–11 May | YouGov | The Sunday Times | 1,962 | 34% | 38% | 15% | 14% | 4 |
| 10 May | Tony Blair announces he will resign as leader of the Labour Party and Prime Minister on 27 June | |||||||
| 23–25 Apr | YouGov | The Daily Telegraph | 2,019 | 32% | 37% | 18% | 14% | 5 |
| 19–25 Apr | Ipsos MORI | The Observer | 1,163 | 31% | 38% | 20% | 11% | 7 |
| 20–22 Apr | ICM | The Guardian | 1,005 | 30% | 37% | 21% | 12% | 7 |
| 13–15 Apr | Populus | The Times | 1,503 | 29% | 37% | 20% | 14% | 8 |
| 4–5 Apr | YouGov | The Sunday Times | 2,218 | 31% | 39% | 16% | 14% | 8 |
| 26–28 Mar | YouGov | The Daily Telegraph | 2,042 | 32% | 39% | 17% | 13% | 7 |
| 23–25 Mar | Communicate | N/A | 1,002 | 31% | 35% | 20% | 14% | 4 |
| 21–22 Mar | YouGov | The Daily Telegraph | 2,752 | 31% | 39% | 16% | 14% | 8 |
| 16–18 Mar | ICM | The Guardian | 1,011 | 31% | 41% | 18% | 10% | 10 |
| 15–16 Mar | YouGov | The Sunday Times | 1,897 | 32% | 38% | 16% | 14% | 6 |
| 9–15 Mar | Ipsos MORI | N/A | 1,983 | 33% | 41% | 17% | 9% | 8 |
| 2–4 Mar | Populus | The Times | 1,509 | 30% | 38% | 18% | 14% | 8 |
| 23–25 Feb | Communicate | N/A | 1,001 | 29% | 40% | 17% | 14% | 11 |
| 19–21 Feb | YouGov | The Daily Telegraph | 2,292 | 32% | 37% | 17% | 14% | 5 |
| 16–18 Feb | ICM | The Guardian | 1,000 | 31% | 40% | 19% | 10% | 9 |
| 8–9 Feb | YouGov | The Sunday Times | 2,019 | 32% | 37% | 18% | 14% | 5 |
| 2–4 Feb | Populus | The Times | 1,509 | 33% | 36% | 19% | 12% | 3 |
| 19–29 Jan | Ipsos MORI | N/A | 949 | 35% | 39% | 19% | 7% | 4 |
| 26–28 Jan | Communicate | N/A | 1,008 | 29% | 34% | 21% | 16% | 5 |
| 22–24 Jan | YouGov | The Daily Telegraph | 2,245 | 31% | 38% | 18% | 13% | 7 |
| 19–21 Jan | ICM | The Guardian | 1,004 | 31% | 37% | 23% | 9% | 6 |
| 5–7 Jan | Populus | The Times | 1,507 | 32% | 39% | 18% | 11% | 7 |
2006
| Date(s) Conducted |
Polling Organisation / Client | Sample size |
Lab | Con | LD | Others | Lead |
|---|---|---|---|---|---|---|---|
| 20–22 Dec | YouGov/Sunday Times | 1,918 | 32% | 37% | 15% | 15% | 5 |
| 18–20 Dec | YouGov/Daily Telegraph | 1,874 | 33% | 37% | 17% | 13% | 4 |
| 19–20 Dec | Communicate Archived 4 March 2016 at the Wayback Machine | 1,009 | 37% | 36% | 14% | 14% | 1 |
| 15–17 Dec | ICM/The Guardian | 1,006 | 32% | 40% | 18% | 10% | 8 |
| 9–12 Dec | Ipsos MORI | 1,938 | 36% | 37% | 18% | 9% | 1 |
| 8–10 Dec | Populus/The Times | 1,513 | 33% | 34% | 19% | 14% | 1 |
| 28–30 Nov | YouGov/Daily Telegraph | 1,979 | 32% | 37% | 16% | 15% | 5 |
| 29–30 Nov | ICM/News of the World | 1,006 | 31% | 39% | 20% | 10% | 8 |
| 24–26 Nov | Communicate Archived 3 March 2016 at the Wayback Machine | 1,004 | 36% | 34% | 17% | 12% | 2 |
| 17–19 Nov | ICM/The Guardian | 1,000 | 32% | 37% | 22% | 9% | 5 |
| 9–14 Nov | Ipsos MORI | 1,115 | 33% | 35% | 20% | 12% | 2 |
| 3–5 Nov | Populus/The Times | 1,510 | 33% | 36% | 20% | 11% | 3 |
| 24–26 Oct | YouGov/Daily Telegraph | 1,722 | 32% | 39% | 16% | 13% | 7 |
| 20–22 Oct | Communicate Archived 14 March 2016 at the Wayback Machine | 977 | 32% | 38% | 14% | 15% | 6 |
| 20–22 Oct | ICM/The Guardian | 1,019 | 29% | 39% | 22% | 9% | 10 |
| 12–16 Oct | Ipsos MORI/Financial Times | 1,113 | 37% | 35% | 18% | 10% | 2 |
| 6–8 Oct | Populus/The Times | 1,515 | 35% | 36% | 18% | 11% | 1 |
| 4–5 Oct | ICM/Sunday Telegraph | 1,005 | 32% | 38% | 20% | 10% | 6 |
| 28–30 Sep | ICM/Sunday Mirror | 1,029 | 35% | 36% | 19% | 11% | 1 |
| 27–29 Sep | YouGov/Daily Telegraph | 1,849 | 36% | 36% | 16% | 12% | Tie |
| 21–22 Sep | YouGov/Sunday Times | 1,546 | 33% | 37% | 18% | 12% | 4 |
| 19–22 Sep | YouGov/Daily Telegraph | 1,733 | 31% | 38% | 18% | 13% | 7 |
| 19–20 Sep | ICM/The Guardian | 1,066 | 32% | 36% | 22% | 10% | 4 |
| 13–14 Sep | ICM/Sunday Mirror | 1,003 | 33% | 37% | 21% | 8% | 4 |
| 13–14 Sep | YouGov/The Sun | 1,519 | 31% | 38% | 18% | 14% | 7 |
| 6–7 Sep | YouGov/Daily Telegraph | 1,504 | 32% | 40% | 17% | 11% | 8 |
| 31 Aug – 6 Sep | Ipsos MORI/Sunday Times | 1,186 | 36% | 35% | 19% | 10% | 1 |
| 1–3 Sep | Populus/The Times | 1,504 | 32% | 36% | 20% | 13% | 4 |
| 22–24 Aug | YouGov/Daily Telegraph | 1,757 | 31% | 38% | 18% | 13% | 7 |
| 18–20 Aug | ICM/The Guardian | 1,007 | 31% | 40% | 22% | 8% | 9 |
| 24–26 Jul | YouGov/Daily Telegraph | 1,633 | 33% | 38% | 18% | 11% | 5 |
| 20–24 Jul | Ipsos MORI | 1,897 | 32% | 36% | 24% | 8% | 4 |
| 21–23 Jul | ICM/The Guardian | 1,001 | 35% | 39% | 17% | 9% | 4 |
| 7–9 Jul | Populus/The Times | 1,512 | 34% | 36% | 19% | 11% | 2 |
| 29 Jun | Blaenau Gwent by-election (BGPV gain from Ind) and Bromley & Chislehurst by-election (Con hold) | ||||||
| 28–29 Jun | ICM/Sunday Telegraph | 1,003 | 35% | 36% | 18% | 11% | 1 |
| 26–28 Jun | YouGov/Daily Telegraph | 1,962 | 33% | 39% | 18% | 10% | 6 |
| 22–26 Jun | Ipsos MORI | 1,931 | 33% | 36% | 21% | 10% | 3 |
| 21–23 Jun | YouGov/Daily Telegraph | 2,009 | 32% | 39% | 17% | 12% | 7 |
| 16–18 Jun | ICM/The Guardian | 1,005 | 32% | 37% | 21% | 9% | 5 |
| 8–12 Jun | Ipsos MORI/The Observer | 1,975 | 34% | 41% | 18% | 7% | 7 |
| 2–4 Jun | Populus/The Times | 1,505 | 34% | 37% | 18% | 11% | 3 |
| 25–30 May | Ipsos MORI | 1,984 | 31% | 41% | 18% | 10% | 10 |
| 23–25 May | YouGov/Daily Telegraph | 2,102 | 32% | 38% | 16% | 14% | 6 |
| 19–21 May | ICM/The Guardian | 1,001 | 34% | 38% | 20% | 8% | 4 |
| 8–9 May | YouGov/Daily Telegraph | 1,910 | 31% | 37% | 17% | 15% | 6 |
| 5–7 May | Populus/The Times | 1,516 | 30% | 38% | 20% | 11% | 8 |
| 4 May | Local elections in England | ||||||
| 27 Apr – 2 May | Ipsos MORI/Financial Times | 1,078 | 32% | 36% | 21% | 11% | 4 |
| 27–28 Apr | YouGov/Sunday Times | 1,930 | 32% | 35% | 18% | 15% | 3 |
| 21–23 Apr | ICM/The Guardian | 1,006 | 32% | 34% | 24% | 10% | 2 |
| 20–22 Apr | Ipsos MORI/The Sun | 1,006 | 30% | 30% | 25% | 15% | Tie |
| 18–20 Apr | YouGov/Daily Telegraph | 2,075 | 35% | 33% | 17% | 15% | 2 |
| 31 Mar – 2 Apr | Populus/The Times | 1,503 | 36% | 34% | 21% | 10% | 2 |
| 27–29 Mar | YouGov/Daily Telegraph | 1,873 | 36% | 36% | 18% | 10% | Tie |
| 16–21 Mar | Ipsos MORI | 1,155 | 39% | 34% | 19% | 8% | 5 |
| 16–18 Mar | ICM/Sunday Telegraph | 1,003 | 37% | 33% | 21% | 9% | 4 |
| 16–17 Mar | YouGov/Sunday Times | 1,811 | 35% | 38% | 19% | 8% | 3 |
| 10–12 Mar | ICM/The Guardian | 1,006 | 37% | 34% | 21% | 8% | 3 |
| 3–5 Mar | Populus/The Times | 1,509 | 35% | 35% | 20% | 9% | Tie |
| 2 Mar | Sir Menzies Campbell is elected leader of the Liberal Democrats | ||||||
| 21–22 Feb | YouGov/Daily Telegraph | 2,019 | 36% | 38% | 18% | 9% | 2 |
| 16–20 Feb | Ipsos MORI/The Sun | 1,143 | 38% | 35% | 20% | 7% | 3 |
| 17–19 Feb | ICM/The Guardian | 1,002 | 34% | 37% | 21% | 8% | 3 |
| 9–10 Feb | YouGov/Sunday Times | 1,617 | 39% | 37% | 15% | 10% | 2 |
| 9 Feb | Dunfermline and West Fife by-election (LD gain from Lab) | ||||||
| 3–5 Feb | Populus/The Times | 1,508 | 36% | 37% | 18% | 9% | 1 |
| 24–26 Jan | YouGov/Daily Telegraph | 2,096 | 40% | 39% | 13% | 9% | 1 |
| 19–23 Jan | Ipsos MORI | 1,163 | 38% | 40% | 17% | 5% | 2 |
| 20–22 Jan | ICM/The Guardian | 1,009 | 36% | 37% | 19% | 7% | 1 |
| 12–17 Jan | Ipsos MORI/The Sun | 541 | 39% | 39% | 15% | 7% | Tie |
| 6–8 Jan | Populus/The Times | 1,509 | 39% | 36% | 16% | 9% | 3 |
| 7 Jan | Charles Kennedy resigns as leader of the Liberal Democrats | ||||||
2005
| Date(s) Conducted |
Polling Organisation / Client | Sample size |
Lab | Con | LD | Others | Lead |
|---|---|---|---|---|---|---|---|
| 15–18 Dec | ICM/The Guardian | 1,004 | 36% | 37% | 21% | 7% | 1 |
| 13–15 Dec | YouGov/Daily Telegraph | 2,071 | 36% | 38% | 18% | 8% | 2 |
| 9–12 Dec | MORI/The Observer | 1,000 | 31% | 40% | 20% | 9% | 9 |
| 9–11 Dec | Populus/The Times | 1,521 | 38% | 35% | 19% | 8% | 3 |
| 6–8 Dec | YouGov/Sunday Times | 2,089 | 36% | 37% | 18% | 8% | 1 |
| 7–8 Dec | ICM/The Guardian | 1,003 | 35% | 37% | 21% | 7% | 2 |
| 6 Dec | David Cameron is elected leader of the Conservative Party | ||||||
| 5–6 Dec | YouGov/Sky News | 1,612 | 36% | 36% | 18% | 10% | Tie |
| 22–24 Nov | YouGov/Daily Telegraph | 2,616 | 37% | 35% | 20% | 8% | 2 |
| 17–22 Nov | MORI | 1,089 | 42% | 32% | 19% | 7% | 10 |
| 18–20 Nov | ICM/The Guardian | 1,013 | 38% | 33% | 19% | 10% | 5 |
| 4–6 Nov | Populus/The Times | 1,512 | 40% | 32% | 19% | 9% | 8 |
| 2–3 Nov | ICM/Sunday Telegraph | 1,010 | 39% | 33% | 21% | 7% | 6 |
| 25–27 Oct | YouGov/Daily Telegraph | 1,947 | 40% | 32% | 19% | 9% | 8 |
| 20–25 Oct | MORI | 1,904 | 40% | 34% | 21% | 5% | 6 |
| 19–20 Oct | ICM/The Guardian | 1,007 | 36% | 33% | 22% | 8% | 3 |
| 7–9 Oct | Populus/The Times | 1,509 | 40% | 30% | 21% | 9% | 10 |
| 5–6 Oct | ICM/News of the World | 1,015 | 38% | 32% | 22% | 8% | 5 |
| 29 Sep | Livingston by-election (Lab hold) | ||||||
| 27–29 Sep | YouGov/Daily Telegraph | 2,183 | 40% | 32% | 20% | 9% | 8 |
| 22–26 Sep | MORI | 1,132 | 39% | 29% | 25% | 7% | 10 |
| 16–17 Sep | ICM/The Guardian | 1,013 | 40% | 31% | 21% | 8% | 9 |
| 8–9 Sep | YouGov/Sunday Times | 1,856 | 37% | 32% | 21% | 10% | 5 |
| 2–4 Sep | Populus/The Times | 1,506 | 37% | 35% | 20% | 8% | 2 |
| 19–24 Aug | YouGov/Daily Telegraph | – | 40% | 33% | 20% | 7% | 7 |
| 11–15 Aug | MORI | 1,191 | 39% | 31% | 24% | 6% | 8 |
| 12–14 Aug | ICM/The Guardian | 1,006 | 38% | 31% | 22% | 9% | 7 |
| 26–28 Jul | YouGov/Daily Telegraph | – | 40% | 31% | 21% | 8% | 9 |
| 22–24 Jul | Populus/The Times | 1,506 | 40% | 28% | 22% | 10% | 12 |
| 14–18 Jul | MORI/The Observer | 1,227 | 41% | 28% | 25% | 6% | 13 |
| 15–17 Jul | ICM/The Guardian | 1,005 | 39% | 31% | 23% | 7% | 8 |
| 14 Jul | Cheadle by-election (LD hold) | ||||||
| 28–30 Jun | YouGov/Daily Telegraph | 3,717 | 38% | 33% | 20% | 9% | 5 |
| 16–20 Jun | MORI | 1,227 | 42% | 29% | 21% | 8% | 13 |
| 17–19 Jun | ICM/The Guardian | 1,005 | 38% | 31% | 23% | 8% | 7 |
| 24–26 May | YouGov/Daily Telegraph | – | 38% | 31% | 23% | 8% | 7 |
| 19–23 May | MORI/Financial Times | 1,274 | 37% | 30% | 26% | 7% | 7 |
| 5 May 2005 | 2005 general election | – | 36.2% | 33.2% | 22.7% | 7.9% | 3.0 |
Exit poll
An exit poll, collected by Ipsos MORI and GfK NOP for the BBC, ITN and Sky News, was published at 22:00 at the end of voting. Data was gathered from 130 polling stations across the country.[3]
| Parties | Seats | Change | |
|---|---|---|---|
| Conservative Party | 307 |  97 97
| |
| Labour Party | 255 |  94 94
| |
| Liberal Democrats | 59 | 3
| |
| Others[b] | 29 | 
| |
| Hung Parliament (Conservatives 19 seats short of majority) | |||
Initial reaction to the exit poll by various commentators was of surprise at the apparent poor prospects for the Liberal Democrats[4] because it was odds with many opinion polls undertaken in the previous weeks. However, the actual results showed that the exit poll was a good predictor.
A later BBC forecast (05:36 BST) predicted the Conservatives on 306, 20 short of an overall majority, Labour on 262, and Liberal Democrats on 55.[5]
Sub-national poll results
Scotland
| Date(s) conducted |
Pollster | Client | Sample size |
Lab | LD | SNP | Con | Others | Lead |
|---|---|---|---|---|---|---|---|---|---|
| 6 May 2010 | 2010 general election | – | 42.0% | 18.9% | 19.9% | 16.7% | 2.5% | 22.1 | |
| 3 May 2010 | YouGov[6] | The Scotsman | 1,507 | 37% | 22% | 21% | 17% | 3% | 15 |
| 21–27 Apr 2010 | TNS-BMRB[6] | Scottish Mail on Sunday | 1,029 | 44% | 16% | 23% | 13% | 4% | 21 |
| 23–26 Apr 2010 | Populus[6] | The Times | 1,000 | 37% | 24% | 19% | 16% | 4% | 13 |
| 14–17 Apr 2010 | Ipsos MORI[6] | STV | 1,005 | 36% | 20% | 26% | 14% | 4% | 10 |
| 24–26 Mar 2010 | YouGov[7] | Scottish Mail on Sunday | 1,008 | 37% | 14% | 24% | 18% | 7% | 13 |
| 3–10 Mar 2010 | YouGov[7] | The Scottish Sun | 720 | 39% | 12% | 26% | 18% | 5% | 13 |
| 24 Feb – 3 Mar 2010 | YouGov[7] | The Scottish Sun | 821 | 39% | 14% | 24% | 18% | 5% | 15 |
| 24–26 Feb 2010 | YouGov[7] | The Scotsman | 1,002 | 35% | 15% | 24% | 20% | 6% | 11 |
| 24–26 Feb 2010 | YouGov[7] | Scottish Mail on Sunday | 1,002 | 38% | 15% | 21% | 20% | 6% | 17 |
| 17–24 Feb 2010 | YouGov[7] | The Scottish Sun | 667 | 42% | 14% | 20% | 19% | 5% | 22 |
| 18–21 Feb 2010 | Ipsos MORI[7] | – | 1,006 | 34% | 12% | 32% | 17% | 5% | 2 |
| 15–17 Feb 2010 | YouGov[7] | The Scottish Sun | 562 | 37% | 15% | 21% | 21% | 6% | 16 |
| 19–23 Nov 2009 | Ipsos MORI[7] | – | 1,009 | 32% | 12% | 34% | 15% | 7% | 2 |
| 18–20 Nov 2009 | YouGov[7] | The Daily Telegraph | 1,141 | 39% | 12% | 24% | 18% | 7% | 15 |
| 28 Oct – 3 Nov 2009 | TNS-BMRB[7] | Herald | 983 | 39% | 12% | 25% | 18% | 6% | 14 |
| 20–31 Aug 2009 | Ipsos MORI[8] | Holyrood Magazine | 1,000 | 27% | 14% | 33% | 18% | 9%
Greens on 4% BNP on 1% UKIP on 1% SSP on 1% Independent on <0.5% Others on <0.5% |
6 |
| 26–28 Aug 2009 | YouGov[7] | Mail on Sunday | 1,183 | 30% | 18% | 26% | 20% | 6% | 4 |
| 24–26 Aug 2009 | YouGov[7] | Daily Mail | 1,078 | 33% | 16% | 25% | 19% | 7% | 8 |
| 2–4 Jun 2009 | YouGov[7] | Sunday Times | 1,048 | 28% | 16% | 31% | 17% | 8% | 3 |
| 22–28 Apr 2009 | TNS System 3[7] | – | 986 | 36% | 9% | 19% | 32% | 4% | 4 |
| 12–13 Mar 2009 | YouGov[7] | Sunday Times | 1,380 | 37% | 11% | 27% | 20% | 5% | 10 |
| 29–30 Jan 2009 | YouGov[7] | Sunday Times | 1,498 | 37% | 12% | 27% | 20% | 4% | 10 |
| 22–24 Oct 2008 | YouGov[7] | Sunday Times | 1,266 | 38% | 11% | 29% | 20% | 2% | 9 |
| 3–5 Sep 2008 | YouGov[7] | Sunday Times | 1,355 | 32% | 13% | 34% | 17% | 4% | 2 |
| 8–10 Jul 2008 | YouGov[7] | The Daily Telegraph | 1,131 | 29% | 14% | 33% | 20% | 4% | 4 |
| 26–29 Apr 2008 | TNS System 3[7] | – | 1,086 | 39% | 10% | 31% | 17% | 3% | 8 |
| 24–28 Apr 2008 | YouGov[7] | The Daily Telegraph | 1,175 | 34% | 14% | 30% | 17% | 5% | 4 |
| 2–4 Apr 2008 | YouGov[7] | The Sun | 1,070 | 35% | 12% | 31% | 17% | 5% | 4 |
| 3–8 Jan 2008 | YouGov[7] | Daily Express | 1,343 | 36% | 12% | 30% | 18% | 4% | 6 |
| 15–17 Aug 2007 | YouGov[7] | Sunday Times | 1,118 | 40% | 11% | 31% | 14% | 4% | 9 |
| 10–12 Jan 2007 | YouGov[7] | Sunday Times | 1,005 | 35% | 15% | 28% | 16% | 6% | 7 |
| 4–8 Jan 2007 | YouGov[7] | Channel 4 | 1,061 | 34% | 15% | 27% | 19% | 5% | 7 |
| 17–22 Nov 2006 | YouGov[7] | The Daily Telegraph | 1,016 | 36% | 16% | 25% | 18% | 5% | 11 |
| 1 Apr – 30 Jun 2006 | Ipsos MORI[9] | – | 520 | 36% | 17% | 24% | 17% | 6% | 12 |
| 1 Jan – 31 Mar 2006 | Ipsos MORI[9] | – | 526 | 44% | 17% | 16% | 19% | 4% | 25 |
| 5 May 2005 | 2005 general election | – | 39.5% | 22.6% | 17.7% | 15.8% | 4.4% | 16.9 | |
Wales
| Date(s) conducted |
Pollster | Client | Sample size |
Lab | Con | LD | PC | Others | Lead |
|---|---|---|---|---|---|---|---|---|---|
| 6 May 2010 | 2010 general election | – | 36.2% | 26.1% | 20.1% | 11.3% | 6.3% | 10.1 | |
| 1–3 May 2010 | YouGov[10] | ITV Wales | Unknown | 35% | 27% | 23% | 10% | 5% | 8 |
| Late Apr 2010 | R&MP[11] | Western Mail | Unknown | 37.5% | 23.5% | 21% | 10.8% | 7.2 | 14 |
| 16–19 Apr 2010 | YouGov[11] | ITV Wales | 1,070 | 33% | 23% | 29% | 9% | 6% | 4 |
| Mar 2010 | NAW[11] | ITV Wales | Unknown | 39% | 27% | 13% | 13% | 9% | 12 |
| Mar 2010 | YouGov[11] | ITV Wales | Unknown | 37% | 29% | 12% | 14% | 7% | 8 |
| Jan 2010 | YouGov[11] | ITV Wales | Unknown | 35% | 32% | 13% | 13% | 7% | 3 |
| Nov 2009 | YouGov[11] | ITV Wales | Unknown | 34% | 31% | 14% | 14% | 7% | 3 |
| 21–23 Oct 2009 | YouGov[10] | University of Aberystwyth | 1,078 | 34% | 31% | 12% | 15% | 7% | 3 |
| Jul 2009 | YouGov[10] | IWP-WGC | Unknown | 28% | 33% | 14% | 14% | 11% | 5 |
| Mar 2009 | Beaufort[10] | Plaid Cymru | Unknown | 41% | 22% | 13% | 17% | 7% | 19 |
| 5 May 2005 | 2005 general election | – | 42.7% | 21.4% | 18.4% | 12.6% | 4.9% | 16.9 | |
Individual constituency poll results
Blaenau Gwent
Blaenau Gwent maintained its 2005 boundaries at the 2010 general election.
| Dates conducted | Pollster | Client | Sample size | Law (Ind) |
Lab | LD | PC | Con | BGPV | Others | Lead |
|---|---|---|---|---|---|---|---|---|---|---|---|
| 6 May 2010 | 2010 general election | – | – | 52.4% | 10.1% | 4.1% | 7.0% | 19.9% | 6.4% | 32.5 | |
| 29 Jun 2006 | 2006 Blaenau Gwent by-election | – | – | 37.0% | 5.4% | 6.5% | 3.7% | 46.7% | 1.2% | 9.7 | |
| 1 Jun 2006 | NOP[12] | – | ? | – | 47% | 6% | 6% | 5% | 35% | – | 12 |
| 5 May 2005 | 2005 general election | – | 58.2% | 32.3% | 4.3% | 2.4% | 2.4% | – | 0.5% | 25.9 | |
Brighton Pavilion
Between the 2005 and 2010 general elections the boundaries of Brighton Pavilion were changed. The Green Party candidate was its leader, Caroline Lucas.
| Dates conducted | Pollster | Client | Sample size | Lab | Con | Grn | LD | UKIP | Others | Lead |
|---|---|---|---|---|---|---|---|---|---|---|
| 6 May 2010 | 2010 general election | – | 28.9% | 23.7% | 31.3% | 13.8% | 1.8% | 1.4% | 2.4 | |
| 16–21 Dec 2009 | ICM[13] | Green Party of England and Wales[14] | 533 | 25% | 27% | 35% | 11% | – | 2% | 8 |
| 5 May 2005 | 2005 general election | – | 35.4% | 23.9% | 21.9% | 16.5% | 1.2% | 1.1% | 11.5 | |
Crewe and Nantwich
Between the 2005 and 2010 general elections the boundaries of Crewe and Nantwich were changed.
| Dates conducted | Pollster | Client | Sample size | Lab | Con | LD | Others | Lead |
|---|---|---|---|---|---|---|---|---|
| 6 May 2010 | 2010 general election | – | 34.0% | 45.8% | 15.0% | 5.1% | 11.8 | |
| 22 May 2008 | 2008 Crewe and Nantwich by-election | – | 30.6% | 49.5% | 14.6% | 5.5% | 18.9 | |
| 15–18 May 2008 | ComRes[15] | The Independent | ? | 35% | 48% | 12% | – | 13 |
| May 2008 | ICM[15] | News of the World | ? | 37% | 45% | 14% | – | 8 |
| 7–8 May 2008 | ICM[15] | Mail on Sunday | ? | 39% | 43% | 16% | – | 4 |
| 5 May 2005 | 2005 general election | – | 48.8% | 32.6% | 18.6% | – | 16.2 | |
Glasgow East
Glasgow East maintained its 2005 boundaries at the 2010 general election.
| Dates conducted | Pollster | Client | Sample size | Lab | SNP | LD | Con | SSP | Others | Lead |
|---|---|---|---|---|---|---|---|---|---|---|
| 6 May 2010 | 2010 general election | – | 61.6% | 24.7% | 5.0% | 4.5% | 1.4% | 2.7% | 36.9 | |
| 24 Jul 2008 | 2008 Glasgow East by-election | – | 41.7% | 43.1% | 3.5% | 6.3% | 2.1% | 3.4% | 1.4 | |
| 14–17 Jul 2008 | Progressive Scottish Opinion[15] | – | ? | 52% | 35% | 7% | 3% | – | – | 17 |
| 10–11 Jul 2008 | ICM[15] | Sunday Telegraph | ? | 47% | 33% | 9% | 7% | – | 4% | 14 |
| 5 May 2005 | 2005 general election | – | 60.7% | 17.0% | 11.8% | 6.9% | 3.5% | – | 43.7 | |
Glasgow North East
Glasgow North East maintained its 2005 boundaries at the 2010 general election.
| Dates conducted | Pollster | Client | Sample size | Spk | SNP | SLP | SSP | BNP | Lab | Con | LD | Others | Lead |
|---|---|---|---|---|---|---|---|---|---|---|---|---|---|
| 6 May 2010 | 2010 general election | – | – | 14.1% | 0.5% | 0.9% | 2.7% | 68.3% | 5.3% | 7.7% | 0.6% | 54.2 | |
| 12 Nov 2009 | 2009 Glasgow North East by-election | – | – | 20.0% | 0.2% | 0.7% | 4.9% | 59.4% | 5.2% | 2.3% | 7.3% | 39.4 | |
| 31 May 2009 | Scottish Opinion[15] | Sunday Times | ? | – | 33% | – | – | – | 51% | 6% | 3% | 7% | 18 |
| 5 May 2005 | 2005 general election | – | 53.3% | 17.7% | 14.2% | 4.9% | 3.2% | – | – | – | 6.7% | 35.6 | |
Glenrothes
Glenrothes maintained its 2005 boundaries at the 2010 general election.
| Dates conducted | Pollster | Client | Sample size | Lab | SNP | LD | Con | Others | Lead |
|---|---|---|---|---|---|---|---|---|---|
| 6 May 2010 | 2010 general election | – | 62.3% | 21.7% | 7.7% | 7.2% | 1.0% | 40.6 | |
| 6 Nov 2008 | 2008 Glenrothes by-election | – | 55.1% | 36.5% | 2.6% | 3.8% | 1.9% | 18.6 | |
| 17 Sep 2008 | ICM[16] | Mail on Sunday | ? | 43% | 43% | 8% | 5% | 1% | Tie |
| 5 May 2005 | 2005 general election | – | 51.9% | 23.4% | 12.7% | 7.1% | 5.0% | 28.5 | |
Norwich North
Between the 2005 and 2010 general elections the boundaries of Norwich North were changed.
| Dates conducted | Pollster | Client | Sample size | Lab | Con | LD | Grn | UKIP | Others | Lead |
|---|---|---|---|---|---|---|---|---|---|---|
| 6 May 2010 | 2010 general election | – | 31.4% | 40.6% | 18.3% | 2.9% | 4.4% | 2.4% | 9.2 | |
| 23 Jul 2009 | 2009 Norwich North by-election | – | 18.2% | 39.5% | 14.0% | 9.7% | 11.8% | 6.8% | 21.3 | |
| 19–21 Jun 2009 | ICM[16] | University of East Anglia | ? | 30% | 34% | 15% | 14% | 7% | 4 | |
| 5 May 2005 | 2005 general election | – | 44.9% | 33.2% | 16.2% | 2.7% | 2.4% | 0.7% | 11.7 | |
See also
- Opinion polling for the 2015 United Kingdom general election
- Opinion polling for the 2005 United Kingdom general election
- 2009 European Parliament election in the United Kingdom
- List of political parties in the United Kingdom
References
Notes
- ^ Michael Martin was originally elected as Labour, but resigned his party member ship upon becoming Speaker in 2000, as per Parliamentary custom.
- ^ This includes the 18 seats in Northern Ireland.
Citations
- ^ Wells, Anthony (10 December 2005). "Tories take the Lead". UKPollingReport. Archived from the original on 18 January 2012. Retrieved 15 March 2010.
- ^ a b c d e f g h BPIX is not a member of the British Polling Council, unlike the other main pollsters such as YouGov, ComRes, Populus, Ipsos MORI, and ICM. Therefore, the full details of its polls are not subject to public disclosure.
- ^ "Exit poll: Tories to fall 19 short of majority". BBC. 6 May 2010. Archived from the original on 17 August 2012. Retrieved 24 December 2023.
- ^ "Parties surprised by exit poll". BBC News. 6 May 2010. Archived from the original on 22 August 2019. Retrieved 7 May 2010.
- ^ "Live coverage – General Election 2010". BBC News. 6 May 2010. Archived from the original on 13 March 2012. Retrieved 6 May 2010.
- ^ a b c d "Opinion Polls 2010". www.electoralcalculus.co.uk. Retrieved 20 February 2026.
- ^ a b c d e f g h i j k l m n o p q r s t u v w x y z aa ab "Electoral Calculus". www.electoralcalculus.co.uk. Archived from the original on 10 April 2010. Retrieved 20 February 2026.
- ^ "Scottish Public Opinion Monitor August 2009 | Ipsos". www.ipsos.com. 14 September 2009. Retrieved 20 February 2026.
- ^ a b "Voting intentions In Scotland 2005-2006 | Ipsos". www.ipsos.com. 7 November 2006. Retrieved 20 February 2026.
- ^ a b c d "Wales: UK General Election Polls" (PDF). Cardiff University. September 2014.
- ^ a b c d e f "YouGov / ITV Wales Survey Results" (PDF). YouGov. 20 April 2010.
- ^ Pack, Mark (January 2026). "PollBase Q4 2025". PollBase.
- ^ "Brighton Pavilion Poll - December 2009" (PDF). ICM Research. 29 December 2009. Archived from the original (PDF) on 7 March 2010.
- ^ "Brighton & Hove Green Party | Caroline Lucas only candidate able to keep out the Conservatives in Brighton Pavilion constituency". www.brightonhovegreens.org. 29 December 2009. Archived from the original on 13 January 2010. Retrieved 19 February 2026.
- ^ a b c d e f Pack, Mark (January 2026). "PollBase Q4 2025". PollBase.
- ^ a b Cite error: The named reference
:02was invoked but never defined (see the help page).
P – The dates when the fieldwork for this poll was carried out is unknown, therefore the date of publication has been given.
External links
- Ipsos Mori archive of all pollsters' polls
- British Polling Council
- Electoral Calculus
- UK Polling Report Election Guide Archived 5 October 2007 at the Wayback Machine
- ICM Polls
- Populus Political Polls
- YouGov Political Polls
- ComRes Polls
- Latest polling results and seat projections from Angus Reid Public Opinion