1994 United States House of Representatives elections in Tennessee
 | ||||||||||||||||||||||||||||
November 8, 1994
| ||||||||||||||||||||||||||||
All 9 Tennessee seats to the United States House of Representatives | ||||||||||||||||||||||||||||
|---|---|---|---|---|---|---|---|---|---|---|---|---|---|---|---|---|---|---|---|---|---|---|---|---|---|---|---|---|
| ||||||||||||||||||||||||||||
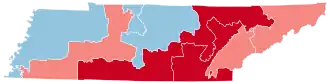   Republican hold Republican gain Democratic hold
| ||||||||||||||||||||||||||||
| Elections in Tennessee |
|---|
 |
 Government Government |
The 1994 congressional elections in Tennessee was held on November 8, 1994, to determine who will represent the state of Tennessee in the United States House of Representatives.
Following the 1994 elections, Republicans gained 2 seats, putting the Tennessee delegation at a 5-4 Republican majority.[1][2] The last time Republicans won a majority in the House delegation was in 1972.
Overview
| United States House of Representatives elections in Tennessee, 1994[1] | |||||
|---|---|---|---|---|---|
| Party | Votes | Percentage | Seats | +/– | |
| Republican | 775,843 | 54.77% | 5 |  2 2
| |
| Democratic | 614,512 | 43.38% | 4 |  2 2
| |
| Independents | 26,069 | 1.84% | 0 | — | |
| Write-ins | 78 | 0.01% | 0 | — | |
| Totals | 1,416,502 | 100.00% | 9 | — | |
By district
| District | Incumbent | This race | |||
|---|---|---|---|---|---|
| Representative | Party | First
elected |
Results | Candidates | |
| Tennessee 1 | Jimmy Quillen | Republican | 1962 | Incumbent re-elected. |
|
| Tennessee 2 | Jimmy Duncan | Republican | 1988 | Incumbent re-elected. |
|
| Tennessee 3 | Marilyn Lloyd | Democratic | 1974 | Incumbent retired. Republican gain. |
|
| Tennessee 4 | Jim Cooper | Democratic | 1982 | Incumbent retired to run for U.S. Senator. Republican gain. |
|
| Tennessee 5 | Bob Clement | Democratic | 1988 | Incumbent re-elected. |
Others
|
| Tennessee 6 | Bart Gordon | Democratic | 1984 | Incumbent re-elected. |
|
| Tennessee 7 | Don Sundquist | Republican | 1982 | Incumbent retired to run for Governor of Tennessee. Republican hold. |
|
| Tennessee 8 | John Tanner | Democratic | 1988 | Incumbent re-elected. |
|
| Tennessee 9 | Harold Ford Sr. | Democratic | 1974 | Incumbent re-elected. |
|

District 1
| Party | Candidate | Votes | % | |
|---|---|---|---|---|
| Republican | Jimmy Quillen (inc.) | 102,947 | 72.89% | |
| Democratic | J. Carr Christian | 34,691 | 24.56% | |
| Independent | George Mauer | 3,576 | 2.53% | |
| Write-In | Write-ins | 13 | 0.01% | |
| Total votes | 141,227 | 100.00% | ||
| Republican hold | ||||
District 2
| Party | Candidate | Votes | % | |
|---|---|---|---|---|
| Republican | Jimmy Duncan (inc.) | 128,937 | 90.49% | |
| Independent | Randon J. Krieg | 6,854 | 4.81% | |
| Independent | Greg Samples | 6,682 | 4.69% | |
| Write-In | Write-ins | 9 | 0.01% | |
| Total votes | 142,482 | 100.00% | ||
| Republican hold | ||||
District 3
| |||||||||||||||||
| |||||||||||||||||
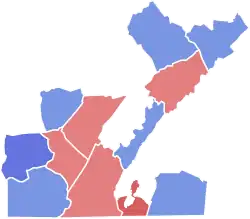 County results Wamp: 50–60% 60–70% Button: 50–60% 60–70% | |||||||||||||||||
| |||||||||||||||||
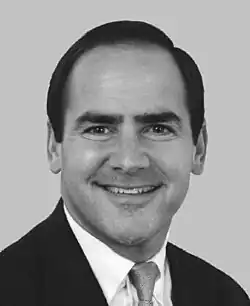

Tennessee’s 3rd congressional district lied in East Tennessee, anchored by Chattanooga and surrounding communities. It included all of Anderson, Bledsoe, Grundy, Hamilton, Marion, Meigs, Morgan, Polk, Roane, Sequatchie, and Van Buren counties, as well as part of Bradley County. The district had been represented by Democrat Marilyn Lloyd, who had served since 1975. Lloyd did not seek re-election to the U.S. House in 1994 after a narrow 1992 victory. She retired and endorsed her successor, Republican Zach Wamp, in the general election.[3]
Wamp’s strength was concentrated in the district’s population centers and most suburban areas. He posted his largest raw vote and margin in Hamilton County, home to Chattanooga, and also carried Bradley County, Bledsoe, Roane, and Sequatchie counties.
Democrat Randy Button performed best in a number of the district’s smaller and more rural counties. He won Grundy, Marion, Meigs, Morgan, Polk, Van Buren, and Anderson Counties. Despite those wins, Button’s margins were not large enough to overcome Wamp’s advantage in Hamilton County and other population centers.[4]
Democratic primary
| Party | Candidate | Votes | % | |
|---|---|---|---|---|
| Democratic | Randy Button | 12,402 | 25.02% | |
| Democratic | Chuck Jolly | 11,256 | 22.71% | |
| Democratic | Whitney Durand | 11,109 | 22.41% | |
| Democratic | Ram Uppuluri | 9,671 | 19.51% | |
| Democratic | Eddie Patterson | 3,210 | 6.48% | |
| Democratic | Dean O'Leary | 967 | 1.95% | |
| Democratic | David Stacy | 952 | 1.92% | |
| Total votes | 49,567 | 100.00% | ||
Republican primary
| Party | Candidate | Votes | % | |
|---|---|---|---|---|
| Republican | Zach Wamp | 39,123 | 67.24% | |
| Republican | Kenneth Meyer | 14,561 | 25.03% | |
| Republican | Kenneth Gross | 3,213 | 5.52% | |
| Republican | Larry Kuka | 1,284 | 2.21% | |
| Total votes | 58,181 | 100.00% | ||
Results
| Party | Candidate | Votes | % | |||
|---|---|---|---|---|---|---|
| Republican | Zach Wamp | 84,583 | 52.26% | |||
| Democratic | Randy Button | 73,839 | 45.62% | |||
| Independent | Thomas Ed Morrrell | 1,929 | 1.19% | |||
| Independent | Richard M. Sims | 1,498 | 0.93% | |||
| Write-In | Write-ins | 4 | 0.00% | |||
| Total votes | 161,853 | 100.00% | ||||
| Republican gain from Democratic | ||||||
District 4
| |||||||||||||||||
| |||||||||||||||||
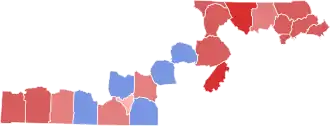 County results Hilleary: 40–50% 50–60% 60–70% 70–80% Whorley: 50–60% | |||||||||||||||||
| |||||||||||||||||

Tennessee's 4th congressional district was located in Middle Tennessee and East Tennessee, stretching across a largely rural region with small cities and manufacturing communities. The district included Bedford, Campbell, Claiborne, Coffee, Cumberland, Fentress, Franklin, Giles, Grainger, Hamblen, Hardin, Lawrence, Lincoln, Moore, Pickett, Rhea, Scott, Union, Warren, Wayne, and White counties, as well as part of Knox County.[5]
Prior to the 1994 election, the district had been represented by six-term Democrat Jim Cooper, first elected in 1982. Cooper chose not to seek re-election to the U.S. House and instead ran for the United States Senate that year; he became the Democratic nominee in the special Senate election but was defeated by Republican Fred Thompson.
With Cooper’s retirement, the open seat drew Republican and Democratic candidates in a year that saw substantial Republican gains nationwide. In the general election, Republican Van Hilleary defeated Democratic nominee Jeff Whorley, winning relatively comfortably and flipping the seat Republican.[6]
Hilleary’s strength was concentrated across much of the district’s eastern and Upper Cumberland counties, where he built large margins. He also carried most of the district’s more rural counties by comfortable margins.
Whorley performed best in some of the district’s southern and more Democratic-leaning counties. He carried Bedford, Franklin, Giles, Warren, and White counties, generally by modest margins.[6]
Democratic primary
| Party | Candidate | Votes | % | |
|---|---|---|---|---|
| Democratic | Jeff Whorley | 20,756 | 30.66% | |
| Democratic | Lincoln Davis | 18,032 | 26.63% | |
| Democratic | Andy Hoover | 16,485 | 24.35% | |
| Democratic | Calvin Moore | 10,363 | 15.31% | |
| Democratic | John Dooley | 2,066 | 3.05% | |
| Democratic | Other | 3 | 0.00% | |
| Total votes | 67,705 | 100.00% | ||
Republican primary
| Party | Candidate | Votes | % | |
|---|---|---|---|---|
| Republican | Van Hilleary | 20,798 | 58.06% | |
| Republican | Keith Hayworth | 9,913 | 27.67% | |
| Republican | Clay Sanders | 5,112 | 14.27% | |
| Republican | Other | 2 | 0.00% | |
| Total votes | 35,825 | 100.00% | ||
Results
| Party | Candidate | Votes | % | |||
|---|---|---|---|---|---|---|
| Republican | Van Hilleary | 81,539 | 56.63% | |||
| Democratic | Jeff Whorley | 60,489 | 42.01% | |||
| Independent | J. Patrick Lyons | 1,944 | 1.35% | |||
| Write-In | Write-ins | 4 | 0.00% | |||
| Total votes | 143,976 | 100.00% | ||||
| Republican gain from Democratic | ||||||
District 5
| Party | Candidate | Votes | % | |
|---|---|---|---|---|
| Democratic | Bob Clement (inc.) | 95,953 | 60.23% | |
| Republican | John Osborne | 61,692 | 38.73% | |
| Independent | Lloyd Botway | 978 | 0.61% | |
| Independent | Chuck Lokey | 664 | 0.42% | |
| Write-In | Write-ins | 17 | 0.01% | |
| Total votes | 159,304 | 100.00% | ||
| Democratic hold | ||||
District 6
| |||||||||||||||||
| |||||||||||||||||
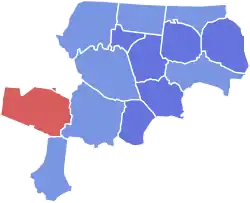 County results Gordon: 50–60% 60–70% Gill: 60–70% | |||||||||||||||||
| |||||||||||||||||

Tennessee’s 6th congressional district lied in Middle Tennessee, including all of Cannon, Clay, DeKalb, Jackson, Macon, Marshall, Overton, Putnam, Rutherford, Smith, Sumner, Trousdale, Wilson, and Williamson Counties, as well as a small southern portion of Davidson County. It had been represented by Democrat Bart Gordon since 1985.
Bart Gordon won every rural county in the district and ran up particularly large margins in the Upper Cumberland, including Jackson, Overton, Smith, and Trousdale. He also carried Cannon, Clay, DeKalb, Macon, Marshall, Putnam, Rutherford, and Sumner.
Republican Steve Gill performed best in the district’s suburban areas. He won the Williamson County portion of the district by a wide margin and also carried the suburban precincts in the district’s share of Davidson County. Those margins, however, were not large enough to offset Gordon’s strength in the district’s rural and exurban areas.[7]
Democratic primary
| Party | Candidate | Votes | % | |
|---|---|---|---|---|
| Democratic | Bart Gordon (incumbent) | 50,751 | 68.40% | |
| Democratic | Dan Rudd | 23,446 | 31.60% | |
| Democratic | Other | 3 | 0.0% | |
| Total votes | 74,200 | 100.00% | ||
| Democratic hold | ||||
Republican primary
| Party | Candidate | Votes | % | |
|---|---|---|---|---|
| Republican | Steve Gill | 29,245 | 99.99% | |
| Republican | Other | 4 | 0.01% | |
| Total votes | 29,249 | 100.00% | ||
Results
| Party | Candidate | Votes | % | |
|---|---|---|---|---|
| Democratic | Bart Gordon (inc.) | 90,933 | 50.60% | |
| Republican | Steve Gill | 88,759 | 49.39% | |
| Write-In | Write-ins | 7 | 0.01% | |
| Total votes | 179,699 | 100.00% | ||
| Democratic hold | ||||
District 7
| |||||||||||||||||
| |||||||||||||||||
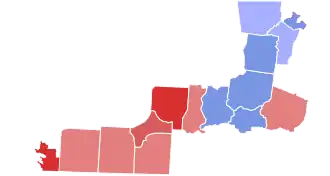 County results Bryant: 50–60% 60–70% 70–80% Byrd: 40–50% 50–60% | |||||||||||||||||
| |||||||||||||||||
Tennessee's 7th congressional district was located in Middle Tennessee and West Tennessee, encompassing a mix of rural counties, small towns, and a portion of Shelby County. The district included Cheatham, Chester, Decatur, Dickson, Fayette, Hardeman, Henderson, Hickman, Lewis, Maury, McNairy, Montgomery, Perry, part of Robertson, and part of Shelby counties.[8]
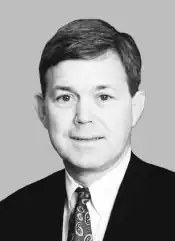
The seat was open following the retirement of the incumbent, Republican Don Sundquist, who successfully ran for governor.
Republican nominee Ed Bryant performed well mainly in the West Tennessee counties and overwhelmingly in the portion of Shelby County within the district, giving him a comfortable overall margin.[9]
Democratic nominee Harold Bryant did well in the northern parts of the district in Middle Tennessee, but his gains were not sufficient to come close to Bryant’s advantage in Shelby County and other southern parts of the district.[9]
Democratic primary
| Party | Candidate | Votes | % | |
|---|---|---|---|---|
| Democratic | Harold Byrd | 20,536 | 35.98% | |
| Democratic | Don Trotter | 13,238 | 23.20% | |
| Democratic | Peggy Knight | 8,532 | 14.95% | |
| Democratic | Frank Lashlee | 7,661 | 13.42% | |
| Democratic | Guthrie Castle | 7,109 | 12.45% | |
| Total votes | 57,076 | 100.00% | ||
Republican primary
| Party | Candidate | Votes | % | |
|---|---|---|---|---|
| Republican | Ed Bryant | 21,776 | 34.93% | |
| Republican | Charles Salvaggio | 20,269 | 32.51% | |
| Republican | Maida Pearson | 10,157 | 16.29% | |
| Republican | Aaron Tatum | 3,410 | 5.47% | |
| Republican | Scotty Kelly | 3,370 | 5.41% | |
| Republican | Willard Summers | 2,192 | 3.52% | |
| Republican | Patrick Hales | 1,173 | 1.88% | |
| Total votes | 62,347 | 100.00% | ||
Results
| Party | Candidate | Votes | % | |
|---|---|---|---|---|
| Republican | Ed Bryant | 102,587 | 60.21% | |
| Democratic | Harold Byrd | 65,851 | 38.65% | |
| Independent | Tom Jeanette | 1,944 | 1.14% | |
| Write-In | Write-ins | 1 | 0.00% | |
| Total votes | 170,383 | 100.00% | ||
| Republican hold | ||||
District 8
| Party | Candidate | Votes | % | |
|---|---|---|---|---|
| Democratic | John Tanner (inc.) | 97,951 | 63.80% | |
| Republican | Neal R. Morris | 55,573 | 36.19% | |
| Write-In | Write-ins | 14 | 0.01% | |
| Total votes | 153,538 | 100.00% | ||
| Democratic hold | ||||
District 9
| Party | Candidate | Votes | % | |
|---|---|---|---|---|
| Democratic | Harold Ford Sr. (inc.) | 94,805 | 57.79% | |
| Republican | Roderick DeBerry | 69,226 | 42.20% | |
| Write-In | Write-ins | 9 | 0.01% | |
| Total votes | 164,040 | 100.00% | ||
| Democratic hold | ||||
See also
- 1994 United States Senate election in Tennessee
- 1994 United States Senate special election in Tennessee
- 1994 Tennessee gubernatorial election
- 1994 United States elections
References
- ^ a b c "1994 House elections" (PDF).
- ^ "Congressional". dsl.richmond.edu. Retrieved September 18, 2024.
- ^ "Representative Marilyn Laird Lloyd". RepBio.org. Retrieved February 11, 2026.
- ^ "1994 Election Results for Tennessee -- RightDataUSA.com". rightdatausa.com. Retrieved February 11, 2026.
- ^ “1994‑11‑08 Tennessee District 04 election results,” county aggregated totals for Van Hilleary, Jeff Whorley, and J. Patrick Lyons. RightDataUSA. Retrieved 2026‑02‑11. https://www.rightdatausa.com/demographics?d=04&s=TN
- ^ a b "1994 Election Results for Tennessee -- RightDataUSA.com". rightdatausa.com. Retrieved February 12, 2026.
- ^ "1994 Election Results for Tennessee -- RightDataUSA.com". rightdatausa.com. Retrieved February 11, 2026.
- ^ "1994 Election Results for Tennessee -- RightDataUSA.com". rightdatausa.com. Retrieved February 11, 2026.
- ^ a b “1994-11-08 Tennessee District 07 election results,” county aggregated totals for Ed Bryant, Harold Byrd, and Tom Jeanette. RightDataUSA. Retrieved 2026-02-11. https://www.rightdatausa.com/demographics?d=07&s=TN