2002 United States House of Representatives elections in Tennessee

2002 United States House of Representatives elections in Tennessee

November 5, 2002 (2002-11-05)

All 9 Tennessee seats to the United States House of Representatives
Turnout50.40% Decrease[1] 12.63 pp
  Majority party Minority party
 
Party Democratic Republican
Last election 4 5
Seats won 5 4
Seat change Increase 1 Decrease 1
Popular vote 708,290 770,514
Percentage 46.31% 50.38%
Swing Increase 2.14% Decrease 3.11%

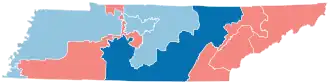
     Democratic hold      Democratic gain
     Republican hold

The 2002 congressional elections in Tennessee was held on November 5, 2002, to determine who will represent the state of Tennessee in the United States House of Representatives.

These elections were the first under Tennessee's new congressional map after redistricting was completed by the state government.[2] Following the 2002 elections, while the Republican Party won a larger share of the statewide popular vote, Democratic nominee Lincoln Davis flipped the 4th congressional district, which was previously represented by Republican Van Hilleary. This flipped the Tennessee delegation to a 5–4 Democratic majority.[3]

Tennessee was one of six states in which the party that won the state's popular vote did not win a majority of seats in 2002, the other states being Connecticut, Illinois, Michigan, New Mexico, and Texas.

Redistricting

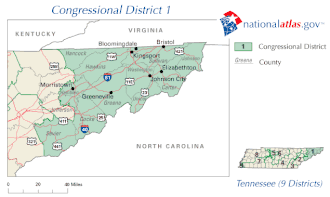
Tennessee's congressional districts, 2003-2013

Following the release of the 2000 United States census data, the Tennessee General Assembly adopted new congressional district boundaries in early 2002 to reflect population shifts and comply with federal equal-population requirements. At the time, the Tennessee Legislature was controlled by the Democratic Party, which held majorities in both chambers of the General Assembly, and the plan was signed into law by Republican Governor Don Sundquist. The redistricting bill for the U.S. House was passed by the legislature on January 10, 2002 and approved by the governor on January 17, 2002.[4]

The 2002 redistricting plan revised several congressional district boundaries and was described by some as a Democratic gerrymander. Despite those claims, the map complied with federal redistricting requirements and was not overturned in court.[5][6]

Overview

United States House of Representatives elections in Tennessee, 2002[7]
Party Votes Percentage Seats +/–
Democratic 708,290 46.31% 5 Increase 1
Republican 770,514 50.38% 4 Decrease 1
Independents 48,450 3.17% 0
Write-in 2,055 0.13% 0
Totals 1,529,309 100.00% 9
Popular vote
Republican
50.38%
Democratic
46.31%
Other
3.30%
House seats
Democratic
55.56%
Republican
44.44%

By district

District Incumbent This race
Member Party First elected Results Candidates
Tennessee 1 Bill Jenkins Republican 1996 Incumbent re-elected.
Tennessee 2 Jimmy Duncan Republican 1988 Incumbent re-elected.
  • Green tickY Jimmy Duncan (Republican) 78.98%
  • John Greene (Democratic) 19.91%
Others
  • Joshua Williamson (Independent) 0.60%
  • George Njezic (Independent) 0.51%
Tennessee 3 Zach Wamp Republican 1994 Incumbent re-elected.
  • Green tickY Zach Wamp (Republican) 64.54%
  • John Wolfe Jr. (Democratic) 33.82%
  • William Bolen (Independent) 1.00%
  • Timothy Sevier (Independent) 0.54%
Tennessee 4 Van Hilleary Republican 1994 Incumbent retired to run for Governor of Tennessee.
New member elected.
Democratic gain.
Others
  • William Chandler (Independent) 0.58%
  • John Ray (Independent) 0.33%
  • Bert Mason (Independent) 0.27%
  • Ed Wellmann (Independent) 0.22%
Tennessee 5 Bob Clement Democratic 1988 Incumbent retired to run for U.S. senator.
New member elected.
Democratic hold.
Others
  • Jonathan Farley (Independent) 0.71%
  • Jesse Turner (Independent) 0.51%
Tennessee 6 Bart Gordon Democratic 1984 Incumbent re-elected.
  • Green tickY Bart Gordon (Democratic) 65.92%
  • Robert Garrison (Republican) 32.33%
  • Patrick Lyons (Independent) 1.73%
Tennessee 7 Ed Bryant Republican 1994 Incumbent retired to run for U.S. senator.
New member elected.
Republican hold.
  • Green tickY Marsha Blackburn (Republican) 70.73%
  • Tim Barron (Democratic) 26.48%
  • Rick Patterson (Independent) 2.77%
Tennessee 8 John S. Tanner Democratic 1988 Incumbent re-elected.
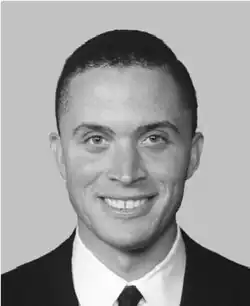
Tennessee 9 Harold Ford Jr. Democratic 1996 Incumbent re-elected.

District 1

2002 Tennessee's 1st congressional district election

 
Nominee Bill Jenkins
Party Republican
Popular vote 127,300
Percentage 98.77%

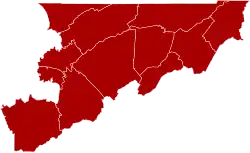
County results
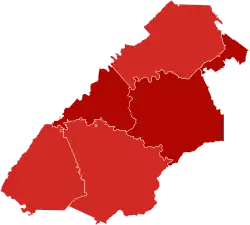
Jenkins:      >90%

U.S. Representative before election

Bill Jenkins
Republican

Elected U.S. Representative

Bill Jenkins
Republican

Tennessee’s 1st congressional district covered northeast Tennessee, including all of Carter, Cocke, Greene, Hamblen, Hancock, Hawkins, Johnson, Sullivan, Unicoi, and Washington counties and parts of Jefferson County and Sevier County. It has been represented by Republican Bill Jenkins.

Democratic primary

  • Write-Ins
Democratic primary results[8]
Party Candidate Votes %
Democratic Write-Ins 494 100.00%
Total votes 494 100.00%

Republican primary

Republican primary results[8]
Party Candidate Votes %
Republican Larry P. Edgell 8,740 11.8%
Republican Bill Jenkins 65,421 88.2%
Republican Write-Ins 50 0.1%
Total votes 74,211 100.0%

Predictions

Source Ranking As of
Sabato's Crystal Ball[9] Safe R November 4, 2002
New York Times[10] Safe R October 14, 2002

Results

Tennessee's 1st congressional district election, 2002
Party Candidate Votes %
Republican Bill Jenkins (inc.) 127,300 98.77%
Write-In Write-ins 1,586 1.23%
Total votes 128,886 100.00%
Republican hold

District 2

2002 Tennessee's 2nd congressional district election

 
Nominee Jimmy Duncan John Greene
Party Republican Democratic
Popular vote 146,887 37,035
Percentage 78.98% 19.91%

County results
Duncan:      70–80%      80–90%

U.S. Representative before election

Jimmy Duncan
Republican

Elected U.S. Representative

Jimmy Duncan
Republican

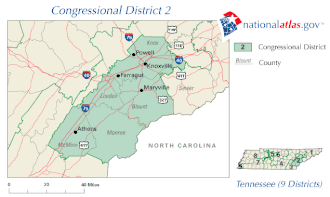
Tennessee’s 2nd congressional district lies in the east-central part of the state, based in Knoxville, and is largely coextensive with that city's metropolitan area. It has been represented by Republican Jimmy Duncan since November 1988. He ran against Democrat Bob Scott. No Democrat has held this seat since 1855.

Democratic primary

  • John Greene
  • Write-Ins
Democratic primary results[8]
Party Candidate Votes %
Democratic John Greene 23,885 100.0%
Democratic Write-Ins 3 0.0%
Total votes 23,888 100.0%

Republican primary

Republican primary results[8]
Party Candidate Votes %
Republican John J. Duncan Jr. 67,582 91.7%
Republican Jim Pendergrass 6,095 8.3%
Total votes 73,677 100.0%

Predictions

Source Ranking As of
Sabato's Crystal Ball[9] Safe R November 4, 2002
New York Times[10] Safe R October 14, 2002

Results

Tennessee's 2nd congressional district election, 2002
Party Candidate Votes %
Republican Jimmy Duncan (inc.) 146,887 78.98%
Democratic John Greene 37,035 19.91%
Independent Joshua Williamson 1,110 0.60%
Independent George Njezic 940 0.51%
Write-In Write-ins 9 0.00%
Total votes 185,981 100.00%
Republican hold

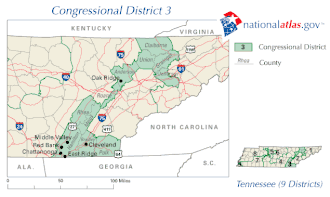
District 3

2002 Tennessee's 3rd congressional district election

 
Nominee Zach Wamp John Wolfe
Party Republican Democratic
Popular vote 112,254 58,824
Percentage 64.54% 33.82%

County results
Wamp:      50–60%      60–70%      70–80%

U.S. Representative before election

Zach Wamp
Republican

Elected U.S. Representative

Zach Wamp
Republican

Tennessee’s 3rd congressional district, which stretches from the Chattanooga metropolitan area in southern Tennessee to Claiborne County in northern Tennessee, is strongly conservative and has been represented by Republican Congressman Zach Wamp since his initial 1994 election.

Democratic primary

  • Norman E. Knott, Jr.
  • John Wolfe
  • Write-Ins
Democratic primary results[8]
Party Candidate Votes %
Democratic Norman E. Knott, Jr. 11,517 33.5%
Democratic John Wolfe 22,731 66.1%
Democratic Write-Ins 150 0.4%
Total votes 34,398 100.0%

Republican primary

Republican primary results[8]
Party Candidate Votes %
Republican Zach Wamp 59,410 99.3%
Republican Write-Ins 392 0.7%
Total votes 59,802 100.0%

Predictions

Source Ranking As of
Sabato's Crystal Ball[9] Safe R November 4, 2002
New York Times[10] Safe R October 14, 2002

Results

Tennessee's 3rd congressional district election, 2002
Party Candidate Votes %
Republican Zach Wamp (inc.) 112,254 64.54%
Democratic John Wolfe 58,824 33.82%
Independent William C. Bolen 1,743 1.00%
Independent Timothy A. Sevier 947 0.54%
Write-In Write-ins 153 0.09%
Total votes 173,921 100.00%
Republican hold

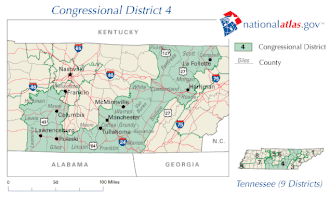
District 4

2002 Tennessee's 4th congressional district election

 
Nominee Lincoln Davis Janice Bowling
Party Democratic Republican
Popular vote 95,989 85,680
Percentage 52.08% 46.49%

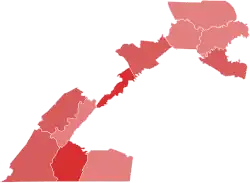
County results
Davis:      50–60%      60–70%
Garrison:      40–50%      50–60%      60–70%

U.S. Representative before election

Van Hilleary
Republican

Elected U.S. Representative

Lincoln Davis
Democratic

Four-term Republican incumbent Van Hilleary gave up the seat to make what would ultimately be an unsuccessful run for governor. Democratic State Senator Lincoln Davis won the open seat, narrowly defeating Republican Tullahoma Alderman Janice Bowling, 52.1%-46.5%.[11]

Predictions

Source Ranking As of
Sabato's Crystal Ball[9] Lean D (flip) November 4, 2002
New York Times[10] Lean D (flip) October 14, 2002

Republican primary

A field of Republican candidates competed for the nomination to succeed incumbent Congressman Van Hilleary, who vacated the seat to run for governor of Tennessee. State Senator Janice Bowling, then a Tullahoma alderwoman, won the nomination with a plurality of the vote, defeating several challengers including Mike Greene and future Congressman Andy Ogles, who was among the better-financed contenders in the race but finished third.[12][13]

Republican primary results[1]
Party Candidate Votes %
Republican Janice Bowling 20,709 37.10%
Republican Mike Greene 13,563 24.30%
Republican Andy Ogles 8,201 14.69%
Republican John Bumpus 7,245 12.98%
Republican Mike Coffield 4,991 8.94%
Republican Harvey Howard 1,063 1.91%
Republican Write-ins 41 0.07%
Total votes 55,813 100.00%

Democratic primary

State Senator Lincoln Davis won the Democratic primary against a self-funding opponent, Fran Marcum of Tullahoma, who spent nearly $2 million in the race.[14]

Democratic primary results[2]
Party Candidate Votes %
Democratic Lincoln Davis 48.843 57.00%
Democratic Fran Marcum 36,779 42.92%
Democratic Write-in 64 0.07%
Total votes 85,686 100.00%

Results

Tennessee's 4th congressional district election, 2002
Party Candidate Votes %
Democratic Lincoln Davis 95,989 52.08%
Republican Janice Bowling 85,680 46.49%
Independent William Tharon Chandler 1,073 0.58%
Independent John Ray 605 0.33%
Independent Bert Mason 504 0.27%
Independent Ed Wellmann 399 0.22%
Write-In Write-ins 50 0.03%
Total votes 184,300 100.00%
Democratic gain from Republican

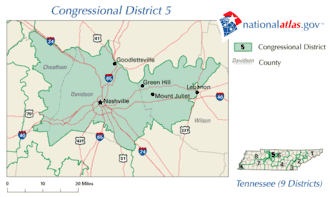
District 5

2002 Tennessee's 5th congressional district election

 
Nominee Jim Cooper Robert Duvall
Party Democratic Republican
Popular vote 108,903 56,825
Percentage 63.73% 33.25%

County results
Cooper:      50–60%      60–70%
Duvall:      40–50%

U.S. Representative before election

Bob Clement
Democratic

Elected U.S. Representative

Jim Cooper
Democratic

Tennessee’s 5th congressional district was centered on Nashville and included portions of the surrounding area. The district was anchored by the majority of Nashville–Davidson County, making Nashville its largest city and primary population center. In addition to Nashville, the district extended into parts of Cheatham County and Wilson County. This included communities such as Ashland City, Pleasant View, and Pegram in Cheatham County, as well as most of Lebanon, as well as Mount Juliet, and Green Hill in Wilson County.[15]

Democratic primary

  • John Arriola
  • Jim Cooper
  • Carlton Cornett
  • Adam Cox
  • David C. Mills
  • Gayle Ray
  • Ronnie Steine
  • Write-Ins
Democratic primary results[8]
Party Candidate Votes %
Democratic Jim Cooper 32,651 46.7%
Democratic John Arriola 16,878 24.2%
Democratic Gayle Ray 16,087 23.0%
Democratic David C. Mills 1,657 2.4%
Democratic Ronnie Steine 901 1.3%
Democratic Carlton Cornett 1,096 1.6%
Democratic Adam Cox 593 0.8%
Democratic Write-Ins 21 0.0%
Total votes 69,884 100.0%

Republican primary

  • Remo Circo
  • Robert Duvall
  • Thomas W. Lawless
  • Ben J. Tomeo
  • Kevin Wilkinson
  • Write-Ins
Republican primary results[8]
Party Candidate Votes %
Republican Robert Duvall 11,572 45.3%
Republican Thomas W. Lawless 5,759 22.5%
Republican Kevin Wilkinson 5,608 21.9%
Republican Remo Circo 2,009 7.9%
Republican Ben J. Tomeo 600 2.3%
Republican Write-Ins 23 0.1%
Total votes 25,571 100.0%

Predictions

Source Ranking As of
Sabato's Crystal Ball[9] Safe D November 4, 2002
New York Times[10] Safe D October 14, 2002

Results

Tennessee's 5th congressional district election, 2002
Party Candidate Votes %
Democratic Jim Cooper 108,903 63.73%
Republican Robert Duvall 56,825 33.25%
Independent John Jay Hooker 3,063 1.79%
Independent Jonathan D. Farley 1,205 0.71%
Independent Jesse Turner 877 0.51%
Write-In Write-ins 13 0.01%
Total votes 170,886 100.00%
Democratic hold

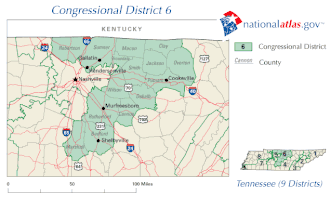
District 6

2002 Tennessee's 6th congressional district election

 
Nominee Bart Gordon Robert L. Garrison
Party Democratic Republican
Popular vote 117,034 57,401
Percentage 65.92% 32.33%

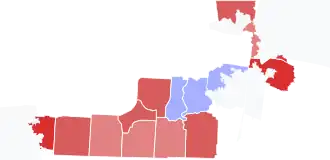
County results
Gordon:      50–60%      60–70%      70–80%      80–90%

U.S. Representative before election

Bart Gordon
Democratic

Elected U.S. Representative

Bart Gordon
Democratic

Tennessee’s 6th congressional district lied in Middle Tennessee, including all of Bedford, Cannon, Clay, DeKalb, Jackson, Macon, Marshall, Overton, Putnam, Robertson, Rutherford, Smith, Sumner, and Trousdale Counties, as well as a portion of Wilson County. It had been represented by Democrat Bart Gordon since 1985.

Democratic primary

Democratic primary results[8]
Party Candidate Votes %
Democratic Bart Gordon 69,121 91.6%
Democratic Harvey Howard 6,255 8.3%
Democratic Write-Ins 99 0.1%
Total votes 75,475 100.0%

Republican primary

  • Robert L. Garrison
  • Write-Ins
Republican primary results[8]
Party Candidate Votes %
Republican Robert L. Garrison 34,329 99.6%
Republican Write-Ins 147 0.4%
Total votes 34,476 100.0%

Predictions

Source Ranking As of
Sabato's Crystal Ball[9] Safe D November 4, 2002
New York Times[10] Safe D October 14, 2002

Results

Tennessee's 6th congressional district election, 2002
Party Candidate Votes %
Democratic Bart Gordon (inc.) 117,034 65.92%
Republican Robert L. Garrison 57,401 32.33%
Independent J. Patrick Lyons 3,065 1.73%
Write-In Write-ins 47 0.03%
Total votes 177,547 100.00%
Democratic hold

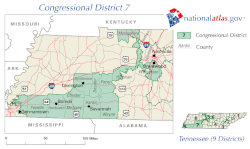
District 7

2002 Tennessee's 7th congressional district election

 
Nominee Marsha Blackburn Tim Barron
Party Republican Democratic
Popular vote 138,314 51,790
Percentage 70.73% 26.48%

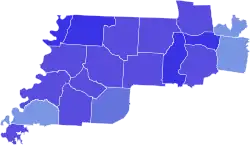
County results
Blackburn:      50–60%      60–70%      70–80%
Barron:      40–50%

U.S. Representative before election

Ed Bryant
Republican

Elected U.S. Representative

Marsha Blackburn
Republican

Tennessee’s 7th congressional district was significantly redrawn following the 2000 census. The newly drawn district stretched from portions of Shelby County in West Tennessee through parts of Middle Tennessee which included the majority of Williamson County and a part of southern suburban Nashville and northward to include Clarksville in Montgomery County, resulting in an unusually long and narrow configuration that combined distant suburban and rural areas into a single congressional district.[16] Critics of the 2002 plan described the changes as a partisan gerrymander by the Democratic-controlled Tennessee General Assembly, which added more Republican-leaning suburbs and retained rural communities, keeping a district that concentrated GOP voters and functioned effectively as a vote sink.[17][18] Incumbent Republican Ed Bryant decided to run for the Senate election.

Democratic primary

  • Tim Barron
  • Omer R. Hayden
  • Write-Ins
Democratic primary results[8]
Party Candidate Votes %
Democratic Tim Barron 22,789 71.0%
Democratic Omer R. Hayden 9,262 28.9%
Democratic Write-Ins 25 0.1%
Total votes 32,076 100.0%

Republican primary

Nominee

Eliminated in primary

Republican primary results
Party Candidate Votes %
Republican Marsha Blackburn 36,633 40.32%
Republican David Kustoff 18,392 20.24%
Republican Brent Taylor 14,139 15.56%
Republican Mark Norris 13,104 14.42%
Republican Forrest Shoaf 7,319 8.06%
Republican Sonny Carlota 642 0.71%
Republican Randy Starkey 628 0.69%
Write-in 9 0.00%
Total votes 90,866 100.00%

Predictions

Source Ranking As of
Sabato's Crystal Ball[9] Safe R November 4, 2002
New York Times[10] Safe R October 14, 2002

Results

Tennessee's 7th congressional district election, 2002
Party Candidate Votes %
Republican Marsha Blackburn 138,314 70.73%
Democratic Tim Barron 51,790 26.48%
Independent Rick Patterson 5,423 2.77%
Write-In Write-ins 31 0.02%
Total votes 195,558 100.00%
Republican hold

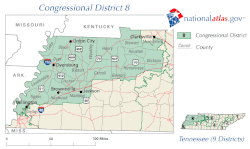
District 8

2002 Tennessee's 8th congressional district election

 
Nominee John S. Tanner Mat McClain
Party Democratic Republican
Popular vote 117,811 45,853
Percentage 70.14% 27.30%

County results
Tanner:      50–60%      60–70%      70–80%      80–90%

U.S. Representative before election

John S. Tanner
Democratic

Elected U.S. Representative

John S. Tanner
Democratic

This Republican-leaning district, rooted in the northwestern portion of the state, had been represented by moderate Democratic Congressman John S. Tanner since 1989. Tanner ran for re-election, and easily defeated Republican candidate Mat McClain, carrying every county.

Democratic primary

Democratic primary results[8]
Party Candidate Votes %
Democratic John Tanner 66,015 86.8%
Democratic Richard Ward 10,069 13.2%
Democratic Write-Ins 12 0.0%
Total votes 76,096 100.0%

Republican primary

  • Mat McClain
  • Bill Warren
  • Write-Ins
Republican primary results[8]
Party Candidate Votes %
Republican Mat McClain 18,878 56.5%
Republican Bill Warren 14,531 43.5%
Republican Write-Ins 26 0.1%
Total votes 33,435 100.0%

Predictions

Source Ranking As of
Sabato's Crystal Ball[9] Safe D November 4, 2002
New York Times[10] Safe D October 14, 2002

Results

Tennessee's 8th congressional district election, 2002
Party Candidate Votes %
Democratic John Tanner (inc.) 117,811 70.14%
Republican Mat McClain 45,853 27.30%
Independent James L. Hart 4,288 2.55%
Write-In Write-ins 18 0.01%
Total votes 167,970 100.00%
Democratic hold

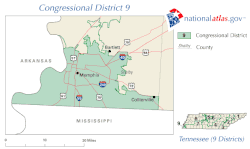
District 9

2002 Tennessee's 9th congressional district election

 
Nominee Harold Ford Jr. Tony Rush
Party Democratic Independent
Popular vote 120,904 23,208
Percentage 83.81% 16.09%

County results
Ford:      80–90%

U.S. Representative before election

Harold Ford Jr.
Democratic

Elected U.S. Representative

Harold Ford Jr.
Democratic

Tennessee’s 9th congressional district, based exclusively within the city of Memphis, has the distinction of being the state's most liberal district, the only district contained within one county, and Tennessee's only African-American majority district. Incumbent Democratic Congressman Harold Ford, Jr. had represented this district since his initial 1996 election.

Democratic primary

Democratic primary results[8]
Party Candidate Votes %
Democratic Harold Ford Jr. 79,146 99.9%
Democratic Write-Ins 46 0.1%
Total votes 79,192 100.0%

Republican primary

  • Write-Ins
Republican primary results[8]
Party Candidate Votes %
Republican Write-Ins 5 100.0%
Total votes 5 100.0%

Predictions

Source Ranking As of
Sabato's Crystal Ball[9] Safe D November 4, 2002
New York Times[10] Safe D October 14, 2002

Results

Tennessee's 9th congressional district election, 2002
Party Candidate Votes %
Democratic Harold Ford Jr. (inc.) 120,904 83.81%
Independent Tony Rush 23,208 16.09%
Write-In Write-ins 148 0.10%
Total votes 144,260 100.00%
Democratic hold

See also

References

  1. ^ "Tennessee Voter Turnout in 2002". Tennessee Secretary of State. November 5, 2002. Retrieved February 28, 2023.
  2. ^ "2000s Redistricting Case Summaries". www.ncsl.org. Retrieved February 16, 2024.
  3. ^ "CNN.com Election 2002 - SpatiaLogic Map: House". www.cnn.com. Retrieved February 16, 2024.
  4. ^ "HB 0274 – Redistricting, Congressional". Tennessee General Assembly. Retrieved February 1, 2026.
  5. ^ "Tennessee: New District Baselines". Cook Political Report. June 28, 2012. Retrieved February 2, 2026.
  6. ^ "Tennessee Redistricting – 2000 Cycle". Retrieved February 1, 2026.
  7. ^ "Historical Election Results | Tennessee Secretary of State". sos.tn.gov. Retrieved February 13, 2024.
  8. ^ a b c d e f g h i j k l m n o "August 1, 2002 Primary Election Results". Tennessee Secretary of State.
  9. ^ a b c d e f g h i "50 most competitive House races of 2002". Sabato's Crystal Ball. November 6, 2002. Archived from the original on November 6, 2002. Retrieved November 24, 2023.
  10. ^ a b c d e f g h i "2002 Senate, House and Governor Ratings". The New York Times. October 14, 2002. Retrieved December 21, 2023.
  11. ^ Christian, Nichole M.; Cushman, John H. Jr; Day, Sherri; Dillon, Sam; Lewis, Neil A.; Pear, Robert; Pristin, Terry; Shenon, Philip; Steinberg, Jacques (November 6, 2002). "The 2002 Elections South Tennessee". The New York Times.

  12. ^ "Tennessee Primary at a Glance". Associated Press. July 31, 2002. Retrieved February 1, 2026.
  13. ^ "Tennessee congressional balance hinges on 4th District". Associated Press. November 5, 2002. Retrieved February 1, 2026.
  14. ^ "Marcum Endorses Lincoln Davis". August 15, 2002.
  15. ^ Davis, Kent (January 12, 2010). "2011 Redistricting TN". TN Precinct Project. Archived from the original on July 17, 2011. Retrieved June 3, 2017.
  16. ^ "Tennessee Redistricting – 2000 Cycle". Retrieved February 1, 2026.
  17. ^ Davis, Kent (January 12, 2010). "2011 Redistricting TN". TN Precinct Project. Archived from the original on July 17, 2011. Retrieved June 3, 2017.
  18. ^ Baker, Jackson, Marsha Blackburn – Beacon of the Right Archived December 10, 2013, at the Wayback Machine, Memphis Magazine, July 2011; retrieved December 6, 2013.
  19. ^ a b c "Our Campaigns - TN District 7 - R Primary Race - Aug 01, 2002". www.ourcampaigns.com. Retrieved September 13, 2025.
  20. ^ "Article clipped from The Leaf-Chronicle". The Leaf-Chronicle. August 9, 2002. p. 2. Retrieved September 13, 2025.