2004 United States House of Representatives elections in Tennessee

2004 United States House of Representatives elections in Tennessee

November 2, 2004 (2004-11-02)

All 9 Tennessee seats to the United States House of Representatives
Turnout66.32% Increase[1] 15.92 pp
  Majority party Minority party
 
Party Democratic Republican
Last election 5 4
Seats won 5 4
Seat change Steady Steady
Popular vote 1,031,959 1,160,821
Percentage 46.51% 52.32%
Swing Increase 0.20% Increase 1.94%

     Democratic hold
     Republican hold

The 2004 congressional elections in Tennessee was held on November 2, 2004, to determine who will represent the state of Tennessee in the United States House of Representatives. Following the 2004 elections, no seats changed hands, leaving the Tennessee delegation at a 5-4 Democratic majority.[2][3]

Tennessee was one of four states in which the party that won the state's popular vote did not win a majority of seats in 2004, the other states being Colorado, Connecticut, and New Mexico.

Overview

United States House of Representatives elections in Tennessee, 2004[4]
Party Votes Percentage Seats +/–
Democratic 1,031,959 46.51% 5
Republican 1,160,821 52.32% 4
Independents 25,686 1.16% 0
Write-in 272 0.01% 0
Totals 2,218,738 100.00% 9
Popular vote
Republican
52.32%
Democratic
46.51%
Other
1.17%
House seats
Democratic
55.56%
Republican
44.44%

By district

District Incumbent Party First

elected

Result Candidates
Tennessee 1 William L. Jenkins Republican 1996 Incumbent re-elected.
  • Green tickY William L. Jenkins (Republican) 73.9%
  • Graham Leonard (Democratic) 24.1%
  • Ralph Ball (Independent) 1.3%
  • Michael Peavler (Independent) 0.7%
Tennessee 2 Jimmy Duncan Jr. Republican 1998 Incumbent re-elected.
  • Green tickY Jimmy Duncan Jr. (Republican) 79.1%
  • John Greene (Democratic) 19.1%
  • Charles Howard (Independent) 1.8%
Tennessee 3 Zach Wamp Republican 1994 Incumbent re-elected.
  • Green tickY Zach Wamp (Republican) 64.7%
  • John Wolfe (Democratic) 32.8%
  • June Griffin (Independent) 1.2%
  • Doug Vandagriff (Independent) 0.7%
  • Jean Howard-Hill (Independent) 0.6%
Tennessee 4 Lincoln Davis Democratic 2002 Incumbent re-elected.
Tennessee 5 Jim Cooper Democratic 1982

1994 (retired) 2002

Incumbent re-elected.
Tennessee 6 Bart Gordon Democratic 1984 Incumbent re-elected.
  • Green tickY Bart Gordon (Democratic) 64.2%
  • Nick Demas (Republican) 33.6%
  • J. Patrick Lyons (Independent) 1.5%
  • Norman Saliba (Independent) 0.7%
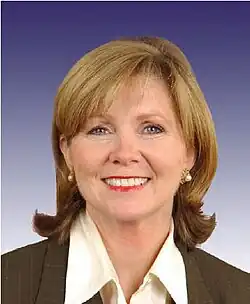
Tennessee 7 Marsha Blackburn Republican 2002 Incumbent re-elected.
Tennessee 8 John Tanner Democratic 1988 Incumbent re-elected.
Tennessee 9 Harold Ford Jr. Democratic 1996 Incumbent re-elected.

District 1

2004 Tennessee's 1st congressional district election

 
Nominee Bill Jenkins Alan Woodruff
Party Republican Democratic
Popular vote 172,543 56,361
Percentage 73.88% 24.13%

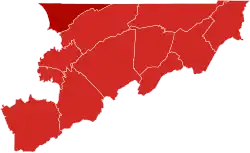
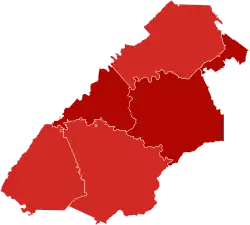
County results
Jenkins:      70–80%      80–90%

U.S. Representative before election

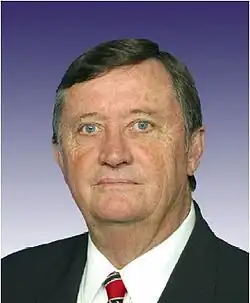
Bill Jenkins
Republican

Elected U.S. Representative

Bill Jenkins
Republican

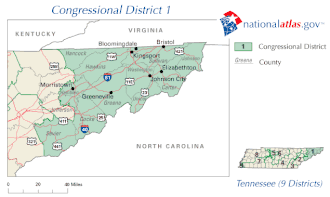
Tennessee’s 1st congressional district covered northeast Tennessee, including all of Carter, Cocke, Greene, Hamblen, Hancock, Hawkins, Johnson, Sullivan, Unicoi, and Washington counties and parts of Jefferson County and Sevier County. It has been represented by Republican Bill Jenkins.

Democratic primary

  • William Malcolm Earp Jr.
  • Lewis Hopkins Jr.
  • Graham Leonard
Democratic primary results[1]
Party Candidate Votes %
Democratic William Malcolm Earp Jr. 2,770 26.92%
Democratic Lewis Hopkins Jr. 2,686 26.10%
Democratic Graham Leonard 4,834 46.98%
Total votes 10,290 100.00%

Republican primary

  • William L. "Bill" Jenkins
  • David R. Smith II
Republican primary results[2]
Party Candidate Votes %
Republican William L. "Bill" Jenkins 32,726 89.73%
Republican David R. Smith II 3,747 10.27%
Total votes 36,473 100.00%

Predictions

Source Ranking As of
The Cook Political Report[5] Safe R October 29, 2004
Sabato's Crystal Ball[6] Safe R November 1, 2004

Results

Tennessee's 1st congressional district election, 2004
Party Candidate Votes %
Republican William L. Jenkins (inc.) 172,543 73.88%
Democratic Graham Leonard 56,361 24.13%
Independent Ralph J. Ball 3,061 1.31%
Independent Michael Peavler 1,595 0.68%
Total votes 233,560 100.00%
Republican hold

District 2

2004 Tennessee's 2nd congressional district election

 
Nominee Jimmy Duncan John Greene
Party Republican Democratic
Popular vote 215,795 52,155
Percentage 79.07% 19.11%

County results
Duncan:      70–80%      80–90%

U.S. Representative before election

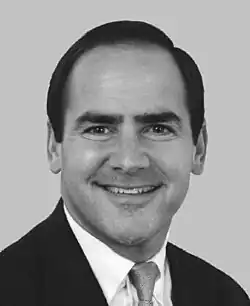
Jimmy Duncan
Republican

Elected U.S. Representative

Jimmy Duncan
Republican

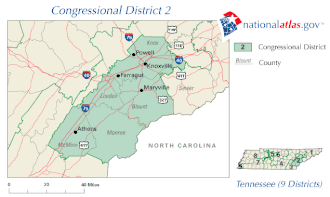
Tennessee’s 2nd congressional district lies in the east-central part of the state, based in Knoxville, and is largely coextensive with that city's metropolitan area. It has been represented by Republican Jimmy Duncan since November 1988. He ran against Democrat Bob Scott. No Democrat has held this seat since 1855.

Democratic primary

  • John Greene
  • Robert R. (Bob) Scott
Democratic primary results
Party Candidate Votes %
Democratic John Greene 6,169 51.62%
Democratic Robert R. (Bob) Scott 5,782 48.38%
Total votes 11,951 100.00%

Republican primary

Republican primary results
Party Candidate Votes %
Republican John J. Duncan Jr. 41,362 91.46%
Republican Debbie Jones Howard 3,861 8.54%
Total votes 45,223 100.00%

Predictions

Source Ranking As of
The Cook Political Report[5] Safe R October 29, 2004
Sabato's Crystal Ball[6] Safe R November 1, 2004

Results

Tennessee's 2nd congressional district election, 2004
Party Candidate Votes %
Republican Jimmy Duncan Jr. (inc.) 215,795 79.07%
Democratic John Greene 52,155 19.11%
Independent Charles E. Howard 4,978 1.82%
Total votes 272,928 100.00%
Republican hold

District 3

2004 Tennessee's 3rd congressional district election

 
Nominee Zach Wamp John Greene
Party Republican Democratic
Popular vote 166,154 84,295
Percentage 64.74% 32.85%

County results
Wamp:      50–60%      60–70%      70–80%

U.S. Representative before election

Zach Wamp
Republican

Elected U.S. Representative

Zach Wamp
Republican

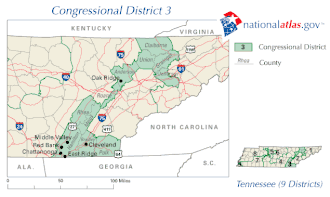
Tennessee’s 3rd congressional district, which stretches from the Chattanooga metropolitan area in southern Tennessee to Claiborne County in northern Tennessee, is strongly conservative and has been represented by Republican Congressman Zach Wamp since his initial 1994 election.

Democratic primary

  • Betty F. Williamson
  • John Wolfe
Democratic primary results
Party Candidate Votes %
Democratic Betty F. Williamson 10,037 40.47%
Democratic John Wolfe 14,766 59.53%
Total votes 24,803 100.00%

Republican primary

Republican primary results
Party Candidate Votes %
Republican Timothy A. Sevier 3,334 9.95%
Republican Zach Wamp 30,183 90.05%
Total votes 33,517 100.00%

Predictions

Source Ranking As of
The Cook Political Report[5] Safe R October 29, 2004
Sabato's Crystal Ball[6] Safe R November 1, 2004

Results

Tennessee's 3rd congressional district election, 2004
Party Candidate Votes %
Republican Zach Wamp (inc.) 166,154 64.74%
Democratic John Wolfe 84,295 32.85%
Independent June Griffin 3,018 1.18%
Independent Doug Vandagriff 1,696 0.66%
Independent Jean Howard-Hill 1,473 0.57%
Total votes 256,636 100.00%
Republican hold

District 4

2004 Tennessee's 4th congressional district election

 
Nominee Lincoln Davis Janice Bowling
Party Democratic Republican
Popular vote 138.459 109,993
Percentage 54.80% 43.54%

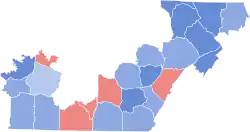
County results
Davis:      40–50%      50–60%      60–70%
Bowling:      50–60%

U.S. Representative before election

Lincoln Davis
Democratic

Elected U.S. Representative

Lincoln Davis
Democratic

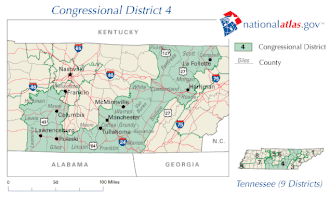
This district lies in Middle and East Tennessee and includes all of Bledsoe, Campbell, Coffee, Cumberland, Fentress, Franklin, Giles, Grundy, Lawrence, Lewis, Lincoln, Marion, Maury, Moore, Morgan, Pickett, Scott, Sequatchie, Van Buren, Warren, and White Counties, as well as portions of Hickman, Roane, and Williamson counties. It has been represented by Democrat Lincoln Davis since 2003.

Democratic primary

  • Lincoln Davis
  • Harvey Howard
Democratic primary results
Party Candidate Votes %
Democratic Lincoln Davis 36,462 91.39%
Democratic Harvey Howard 3,435 8.61%
Total votes 39,897 100.00%

Republican primary

  • Janice Bowling
  • Don Cuva
  • Dale Harvey
Republican primary results
Party Candidate Votes %
Republican Janice Bowling 19,246 86.92%
Republican Dale Harvey 2,431 10.98%
Republican Don Cuva 465 2.10%
Total votes 22,142 100.00%

Predictions

Source Ranking As of
The Cook Political Report[5] Likely D October 29, 2004
Sabato's Crystal Ball[6] Safe D November 1, 2004

Results

Tennessee's 4th congressional district election, 2004
Party Candidate Votes %
Democratic Lincoln Davis (inc.) 138,459 54.80%
Republican Janice Bowling 109,993 43.54%
Independent Ken Martin 4,194 1.66%
Total votes 252,646 100.00%
Democratic hold

District 5

2004 Tennessee's 5th congressional district election

 
Nominee Jim Cooper Scott Knapp
Party Democratic Republican
Popular vote 168,970 74,978
Percentage 69.26% 30.73%

County results
Cooper:      50–60%      70–80%

U.S. Representative before election

Jim Cooper
Democratic

Elected U.S. Representative

Jim Cooper
Democratic

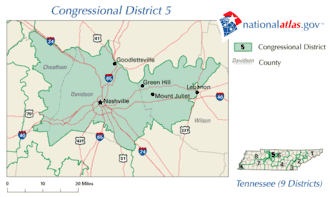
Tennessee’s 5th congressional district was centered on Nashville and included portions of the surrounding area. The district was anchored by the majority of Nashville–Davidson County, making Nashville its largest city and primary population center. In addition to Nashville, the district extended into parts of Cheatham County and Wilson County. This included communities such as Ashland City, Pleasant View, and Pegram in Cheatham County, as well as most of Lebanon, as well as Mount Juliet, and Green Hill in Wilson County.[7]

Democratic primary

Democratic primary results
Party Candidate Votes %
Democratic Jim Cooper 22,396 100.00%
Total votes 22,396 100.00%

Republican primary

  • Scott Knapp
Republican primary results
Party Candidate Votes %
Republican Scott Knapp 8,110 100.00%
Total votes 8,110 100.00%

Predictions

Source Ranking As of
The Cook Political Report[5] Safe D October 29, 2004
Sabato's Crystal Ball[6] Safe D November 1, 2004

Results

Tennessee's 5th congressional district election, 2004
Party Candidate Votes %
Democratic Jim Cooper (inc.) 168,970 69.26%
Republican Scott Knapp 74,978 30.73%
Write-In Thomas F. Kovach 15 0.01%
Total votes 243,963 100.00%
Democratic hold

District 6

2004 Tennessee's 6th congressional district election

 
Nominee Bart Gordon Nick Demas
Party Democratic Republican
Popular vote 167,448 87,523
Percentage 64.24% 33.58%

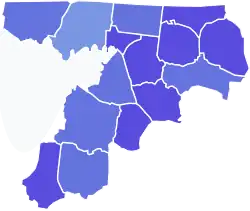
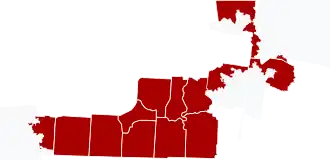
County results
Gordon:      50–60%      60–70%      70–80%

U.S. Representative before election

Bart Gordon
Democratic

Elected U.S. Representative

Bart Gordon
Democratic

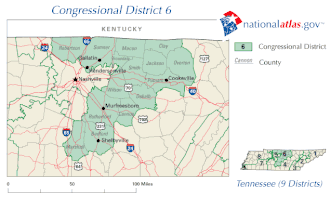
Tennessee’s 6th congressional district lied in Middle Tennessee, including all of Bedford, Cannon, Clay, DeKalb, Jackson, Macon, Marshall, Overton, Putnam, Robertson, Rutherford, Smith, Sumner, and Trousdale Counties, as well as a portion of Wilson County. It had been represented by Democrat Bart Gordon since 1985.

Democratic primary

  • Bart Gordon
  • Robert C. Hall
Democratic primary results
Party Candidate Votes %
Democratic Bart Gordon 28,524 93.25%
Democratic Robert C. Hall 2,066 6.75%
Total votes 30,590 100.00%

Republican primary

  • Nick Demas
  • Elizabeth Hall
Republican primary results
Party Candidate Votes %
Republican Nick Demas 7,657 51.52%
Republican Elizabeth Hall 7,205 48.48%
Total votes 14,862 100.00%

Predictions

Source Ranking As of
The Cook Political Report[5] Safe D October 29, 2004
Sabato's Crystal Ball[6] Safe D November 1, 2004

Results

Tennessee's 6th congressional district election, 2004
Party Candidate Votes %
Democratic Bart Gordon (inc.) 167,448 64.24%
Republican Nick Demas 87,523 33.58%
Independent J. Patrick Lyons 3,869 1.48%
Independent Norman R. Saliba 1,802 0.69%
Total votes 260,642 100.00%
Democratic hold

District 7

2004 Tennessee's 7th congressional district election

 
Nominee Marsha Blackburn
Party Republican
Popular vote 232,404
Percentage 100.00%

County results
Blackburn:      >90%

U.S. Representative before election

Marsha Blackburn
Republican

Elected U.S. Representative

Marsha Blackburn
Republican

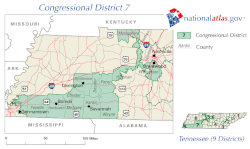
Tennessee’s 7th congressional district stretched from portions of Shelby County in West Tennessee through parts of Middle Tennessee which included the majority of Williamson County and a part of southern suburban Nashville and northward to include Clarksville in Montgomery County, resulting in an unusually long and narrow configuration that combined distant suburban and rural areas into a single congressional district.[8]

Democratic primary

No Democratic primary was held.

Republican primary

Republican primary results
Party Candidate Votes %
Republican Marsha Blackburn 24,233 100.00%
Total votes 24,233 100.00%

Predictions

Source Ranking As of
The Cook Political Report[5] Safe R October 29, 2004
Sabato's Crystal Ball[6] Safe R November 1, 2004

Results

Tennessee's 7th congressional district election, 2004
Party Candidate Votes %
Republican Marsha Blackburn (inc.) 232,404 100.00%
Total votes 232,404 100.00%
Republican hold

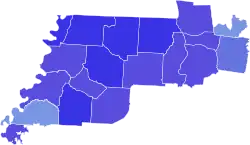
District 8

2004 Tennessee's 8th congressional district election

 
Nominee John Tanner James L. Hart
Party Democratic Republican
Popular vote 173,623 59,853
Percentage 74.34% 25.63%

County results
Tanner:      50–60%      60–70%      70–80%      80–90%

U.S. Representative before election

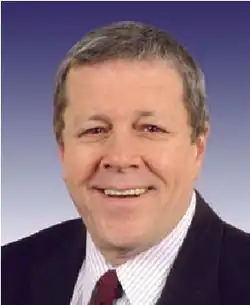
John S. Tanner
Democratic

Elected U.S. Representative

John S. Tanner
Democratic

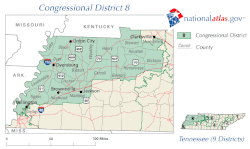
Tennessee’s 8th congressional district, a Republican-leaning district, rooted in the northwestern portion of the state, had been represented by moderate Democratic Congressman John Tanner since 1989.

Republican nominee James L. Hart, a white supremacist and segregationist activist,[9] faced controversy.[10] As the only candidate on the primary ballot (facing only a write-in campaign), he won the Republican nomination, despite listing an out-of-state address in candidate filings. The state Republican Party disavowed his candidacy, describing his views on race as "abhorrent and outrageous" and urging "all Republicans and Tennesseans to reject the candidacy of James Hart wholly and unequivocally."[11] Hart lost to incumbent Democrat John Tanner, receiving 25.6% of the vote.

Democratic primary

  • John Tanner
Democratic primary results
Party Candidate Votes %
Democratic John Tanner 28,427 100.00%
Total votes 28,427 100.00%

Republican primary

Republican primary results
Party Candidate Votes %
Republican James L. Hart 8,227 78.50%
Republican Dennis K. Bertrand 2,253 21.50%
Total votes 10,480 100.00%

Predictions

Source Ranking As of
The Cook Political Report[5] Safe D October 29, 2004
Sabato's Crystal Ball[6] Safe D November 1, 2004

Results

Tennessee's 8th congressional district election, 2004
Party Candidate Votes %
Democratic John Tanner (inc.) 173,623 74.34%
Republican James L. Hart 59,853 25.63%
Write-In Dennis Bertrand 91 0.04%
Total votes 233,567 100.00%
Democratic hold

District 9

2004 Tennessee's 9th congressional district election

 
Nominee Harold Ford Jr. Ruben M. Fort
Party Democratic Republican
Popular vote 190,648 41,578
Percentage 82.04% 17.89%

County results
Ford:      80–90%

U.S. Representative before election

Harold Ford Jr.
Democratic

Elected U.S. Representative

Harold Ford Jr.
Democratic

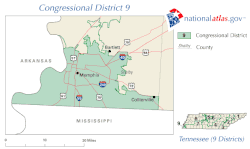
Tennessee’s 9th congressional district, based exclusively within the city of Memphis, has the distinction of being the state's most liberal district, the only district contained within one county, and Tennessee's only African-American majority district. Incumbent Democratic Congressman Harold Ford, Jr. had represented this district since his initial 1996 election.

Democratic primary

Democratic primary results
Party Candidate Votes %
Democratic Harold Ford Jr. 33,708 100.00%
Total votes 33,708 100.00%

Republican primary

  • Ruben M. Fort
Republican primary results
Party Candidate Votes %
Republican Ruben M. Fort 12,532 100.00%
Total votes 12,532 100.00%

Predictions

Source Ranking As of
The Cook Political Report[5] Safe D October 29, 2004
Sabato's Crystal Ball[6] Safe D November 1, 2004

Results

Tennessee's 9th congressional district election, 2004
Party Candidate Votes %
Democratic Harold Ford Jr. (inc.) 190,648 82.04%
Republican Ruben M. Fort 41,578 17.89%
Write-In Jim Maynard 166 0.07%
Total votes 232,392 100.00%
Democratic hold

See also

References

  1. ^ "Tennessee Voter Turnout in 2004". Tennessee Secretary of State. November 2, 2004. Retrieved February 28, 2023.
  2. ^ "CNN.com Election 2004". www.cnn.com. Retrieved February 13, 2024.
  3. ^ "The Election of 2004 – Congressional Election Results". Retrieved February 13, 2024.
  4. ^ "Historical Election Results | Tennessee Secretary of State". sos.tn.gov. Retrieved February 13, 2024.
  5. ^ a b c d e f g h i "2004 Competitive House Race Chart" (PDF). House: Race Ratings. Cook Political Report. October 29, 2004. Archived from the original (PDF) on May 10, 2006. Retrieved November 21, 2023.
  6. ^ a b c d e f g h i "2004 House". Sabato's Crystal Ball. November 3, 2004. Archived from the original on November 11, 2004. Retrieved November 24, 2023.
  7. ^ "TN-5" (PDF).
  8. ^ "Tennessee Redistricting – 2000 Cycle". Retrieved February 1, 2026.
  9. ^ Hart, James. "Hart for Congress". Archived from the original on January 16, 2011. Retrieved April 17, 2023.
  10. ^ Gray, Gary (October 27, 2002). "Well-read rodeo vet challenges Tanner". The Jackson Sun. Retrieved April 17, 2023.
  11. ^ "GOP disavows candidate for his viewpoints on less favored races". The Tennessean. August 12, 2004. Retrieved April 17, 2023.
  12. ^ Hart, James. "Hart for Congress". Archived from the original on January 16, 2011. Retrieved April 17, 2023.
  13. ^ Hart, James. "Hart for Congress 2010 Brochure" (PDF). Archived from the original (PDF) on January 25, 2011. Retrieved April 17, 2023.
  14. ^ Hart, James. "Favored Races". Hart for Congress. Archived from the original on May 25, 2011. Retrieved April 17, 2023.