Results breakdown of the 1979 Spanish local elections (Aragon)
This is the results breakdown of the local elections held in Aragon on 3 April 1979. The following tables show detailed results in the autonomous community's most populous municipalities, sorted alphabetically.[1][2]
City control
The following table lists party control in the most populous municipalities, including provincial capitals (shown in bold).[1]
| Municipality | Population | New control | |
|---|---|---|---|
| Calatayud | 17,599 | Regionalist Aragonese Party (PAR) | |
| Huesca | 38,095 | Union of the Democratic Centre (UCD) | |
| Teruel | 24,590 | Union of the Democratic Centre (UCD) | |
| Zaragoza | 555,424 | Spanish Socialist Workers' Party (PSOE) | |
Municipalities
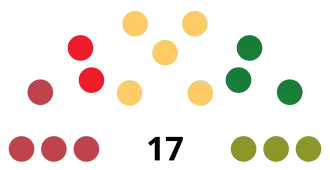
Calatayud
- Population: 17,599
 | ||||||
| Parties and alliances | Popular vote | Seats | ||||
|---|---|---|---|---|---|---|
| Votes | % | ±pp | Total | +/− | ||
| Regionalist Aragonese Party (PAR) | 2,408 | 30.78 | n/a | 5 | n/a | |
| Communist Movement–Organization of Communist Left (MC–OIC) | 1,784 | 22.81 | n/a | 4 | n/a | |
| Democratic Coalition (CD) | 1,449 | 18.52 | n/a | 3 | n/a | |
| Union of the Democratic Centre (UCD) | 1,317 | 16.84 | n/a | 3 | n/a | |
| Spanish Socialist Workers' Party (PSOE) | 864 | 11.05 | n/a | 2 | n/a | |
| Blank ballots | 0 | 0.00 | n/a | |||
| Total | 7,822 | 17 | n/a | |||
| Valid votes | 7,822 | 98.28 | n/a | |||
| Invalid votes | 137 | 1.72 | n/a | |||
| Votes cast / turnout | 7,959 | 61.17 | n/a | |||
| Abstentions | 5,052 | 38.83 | n/a | |||
| Registered voters | 13,011 | |||||
| Sources[1][3] | ||||||
Huesca
- Population: 38,095
 | ||||||
| Parties and alliances | Popular vote | Seats | ||||
|---|---|---|---|---|---|---|
| Votes | % | ±pp | Total | +/− | ||
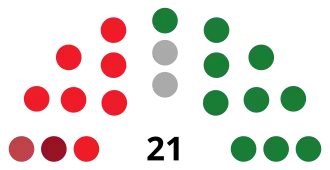
| Union of the Democratic Centre (UCD) | 7,334 | 42.42 | n/a | 10 | n/a | |
| Spanish Socialist Workers' Party (PSOE) | 5,115 | 29.59 | n/a | 7 | n/a | |
| Independent of Huesca (IdH) | 1,924 | 11.13 | n/a | 2 | n/a | |
| Communist Movement of Aragon (MCA) | 1,002 | 5.80 | n/a | 1 | n/a | |
| Communist Party of Spain (PCE) | 999 | 5.78 | n/a | 1 | n/a | |
| Republican Left (IR) | 535 | 3.09 | n/a | 0 | n/a | |
| Party of Labour of Aragon (PTA) | 380 | 2.20 | n/a | 0 | n/a | |
| Blank ballots | 0 | 0.00 | n/a | |||
| Total | 17,289 | 21 | n/a | |||
| Valid votes | 17,289 | 97.88 | n/a | |||
| Invalid votes | 375 | 2.12 | n/a | |||
| Votes cast / turnout | 17,664 | 63.35 | n/a | |||
| Abstentions | 10,217 | 36.65 | n/a | |||
| Registered voters | 27,881 | |||||
| Sources[1][3] | ||||||
Teruel
- Population: 24,590
 | ||||||
| Parties and alliances | Popular vote | Seats | ||||
|---|---|---|---|---|---|---|
| Votes | % | ±pp | Total | +/− | ||
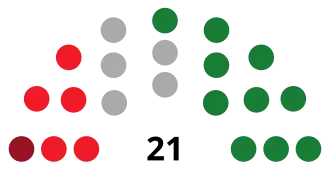
| Union of the Democratic Centre (UCD) | 4,971 | 44.28 | n/a | 10 | n/a | |
| Spanish Socialist Workers' Party (PSOE) | 2,789 | 24.84 | n/a | 5 | n/a | |
| Electoral Group of Teruel (AET) | 2,504 | 22.31 | n/a | 5 | n/a | |
| Communist Party of Spain (PCE) | 677 | 6.03 | n/a | 1 | n/a | |
| Party of Labour of Aragon (PTA) | 183 | 1.63 | n/a | 0 | n/a | |
| Communist Movement of Aragon (MCA) | 102 | 0.91 | n/a | 0 | n/a | |
| Blank ballots | 0 | 0.00 | n/a | |||
| Total | 11,226 | 21 | n/a | |||
| Valid votes | 11,226 | 100.00 | n/a | |||
| Invalid votes | 0 | 0.00 | n/a | |||
| Votes cast / turnout | 11,226 | 62.40 | n/a | |||
| Abstentions | 6,763 | 37.60 | n/a | |||
| Registered voters | 17,989 | |||||
| Sources[1][3] | ||||||
Zaragoza
- Population: 555,424
 | ||||||
| Parties and alliances | Popular vote | Seats | ||||
|---|---|---|---|---|---|---|
| Votes | % | ±pp | Total | +/− | ||
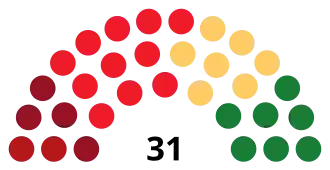
| Spanish Socialist Workers' Party (PSOE) | 71,967 | 30.91 | n/a | 11 | n/a | |
| Union of the Democratic Centre (UCD) | 47,657 | 20.47 | n/a | 7 | n/a | |
| Regionalist Aragonese Party (PAR) | 43,196 | 18.55 | n/a | 7 | n/a | |
| Communist Party of Spain (PCE) | 26,517 | 11.39 | n/a | 4 | n/a | |
| Party of Labour of Aragon (PTA) | 15,314 | 6.58 | n/a | 2 | n/a | |
| Communist Movement–Organization of Communist Left (MC–OIC) | 9,883 | 4.24 | n/a | 0 | n/a | |
| Independent Citizen Candidacy (CCI) | 6,428 | 2.76 | n/a | 0 | n/a | |
| Democratic Coalition (CD) | 5,817 | 2.50 | n/a | 0 | n/a | |
| Coalition for Aragon (PSAr–PSDA) | 4,623 | 1.99 | n/a | 0 | n/a | |
| Republican Left (IR) | 936 | 0.40 | n/a | 0 | n/a | |
| Revolutionary Communist League (LCR) | 511 | 0.22 | n/a | 0 | n/a | |
| Workers' Revolutionary Organization (ORT) | 0 | 0.00 | n/a | 0 | n/a | |
| Blank ballots | 0 | 0.00 | n/a | |||
| Total | 232,849 | 31 | n/a | |||
| Valid votes | 232,849 | 98.68 | n/a | |||
| Invalid votes | 3,111 | 1.32 | n/a | |||
| Votes cast / turnout | 235,960 | 58.56 | n/a | |||
| Abstentions | 166,954 | 41.44 | n/a | |||
| Registered voters | 402,914 | |||||
| Sources[1][3] | ||||||
References
- ^ a b c d e f Lozano, Carles. "Elecciones Municipales en Aragón y La Rioja (desde 1979)". Historia Electoral.com (in Spanish). Retrieved 23 December 2025.
- ^ "Elecciones Municipales. 3 de april de 1979. Aragón". eldiario.es (in Spanish). Retrieved 23 December 2025.
- ^ a b c d "Elecciones celebradas. Resultados electorales" (in Spanish). Ministry of the Interior. Retrieved 23 December 2025.
 Elections in Aragon Elections in Aragon | |
|---|---|
| Regional elections | |
| General elections | |
| European Parliament elections | |
| Local elections | |