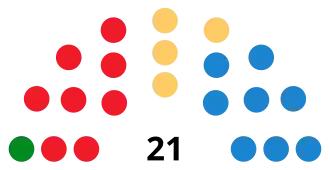
Results breakdown of the 2003 Spanish local elections (Aragon)

This is the results breakdown of the local elections held in Aragon on 25 May 2003. The following tables show detailed results in the autonomous community's most populous municipalities, sorted alphabetically.[1][2]

City control

The following table lists party control in the most populous municipalities, including provincial capitals (shown in bold).[1] Gains for a party are displayed with the cell's background shaded in that party's colour.

Municipality Population Previous control New control
Calatayud 18,531 People's Party (PP) People's Party (PP)
Huesca 46,462 Spanish Socialist Workers' Party (PSOE) Spanish Socialist Workers' Party (PSOE)
Teruel 31,506 People's Party (PP) Spanish Socialist Workers' Party (PSOE)
Zaragoza 620,419 People's Party (PP) Spanish Socialist Workers' Party (PSOE)

Municipalities

Calatayud

Population: 18,531
Summary of the 25 May 2003 City Council of Calatayud election results
Parties and alliances Popular vote Seats
Votes % ±pp Total +/−
People's Party (PP) 5,678 55.69 −14.37 11 −2
Spanish Socialist Workers' Party (PSOE) 2,509 24.61 +8.30 4 +1
Aragonese Union (CHA) 1,171 11.48 +6.46 2 +1
Aragonese Party (PAR) 439 4.31 +1.22 0 ±0
United Left of Aragon (IU) 179 1.76 −1.98 0 ±0
Blank ballots 220 2.16 +0.38
Total 10,196 17 ±0
Valid votes 10,196 98.40 −0.83
Invalid votes 166 1.60 +0.83
Votes cast / turnout 10,362 71.53 +2.55
Abstentions 4,124 28.47 −2.55
Registered voters 14,486
Sources[1][3][4]

Huesca

Population: 46,462
Summary of the 25 May 2003 City Council of Huesca election results
Parties and alliances Popular vote Seats
Votes % ±pp Total +/−
Spanish Socialist Workers' Party (PSOE) 11,818 47.94 +16.93 12 +5
People's Party (PP) 6,765 27.44 −2.80 6 −1
Aragonese Union (CHA) 2,430 9.86 −4.35 2 −1
Aragonese Party (PAR) 1,932 7.84 −5.67 1 −2
United LeftThe Greens (IU–LV) 1,011 4.10 −1.08 0 −1
Family and Life Party (PFyV) 58 0.24 New 0 ±0
Aragonese Initiative (INAR) 53 0.22 New 0 ±0
Blank ballots 583 2.37 −1.67
Total 24,650 21 ±0
Valid votes 24,650 99.16 +0.19
Invalid votes 210 0.84 −0.19
Votes cast / turnout 24,860 64.56 +6.90
Abstentions 13,649 35.44 −6.90
Registered voters 38,509
Sources[1][3][4]

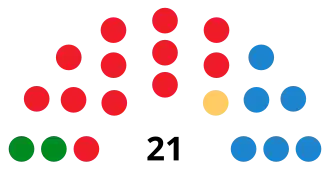
Teruel

Population: 31,506
Summary of the 25 May 2003 City Council of Teruel election results
Parties and alliances Popular vote Seats
Votes % ±pp Total +/−
People's Party (PP) 6,239 36.58 −2.67 8 −1
Spanish Socialist Workers' Party (PSOE) 5,695 33.39 +7.15 8 +2
Aragonese Party (PAR) 2,801 16.42 −2.08 4 ±0
Aragonese Union (CHA) 1,166 6.84 +0.15 1 ±0
United Left of Aragon (IU) 688 4.03 −1.61 0 −1
Family and Life Party (PFyV) 37 0.22 New 0 ±0
Humanist Party (PH) 27 0.16 −0.19 0 ±0
Aragonese Initiative (INAR) 21 0.12 New 0 ±0
Blank ballots 383 2.25 −1.07
Total 17,057 21 ±0
Valid votes 17,057 99.05 −0.19
Invalid votes 164 0.95 +0.08
Votes cast / turnout 17,221 68.39 +8.04
Abstentions 7,960 31.61 −8.04
Registered voters 25,181
Sources[1][3][4]

Zaragoza

Population: 620,419

See also

References

  1. ^ a b c d e Lozano, Carles. "Elecciones Municipales en Aragón y La Rioja (desde 1979)". Historia Electoral.com (in Spanish). Retrieved 23 December 2025.
  2. ^ "Elecciones Municipales. 25 de mayo de 2003. Aragón". eldiario.es (in Spanish). Retrieved 23 December 2025.
  3. ^ a b c "Elecciones celebradas. Resultados electorales" (in Spanish). Ministry of the Interior. Retrieved 23 December 2025.
  4. ^ a b c "Acuerdo de 20 de junio de 2003, de la Junta Electoral Central, por el que se procede a la publicación del resumen de los resultados de las elecciones locales convocadas por Real Decreto 374/2003, de 31 de marzo, y celebradas el 25 de mayo, según los datos que figuran en las actas de proclamación remitidas por cada una de las Juntas Electorales de Zona" (PDF). Official State Gazette (in Spanish) (158 (Supplement)): 1–700. 3 July 2003. ISSN 0212-033X. Retrieved 23 December 2025.